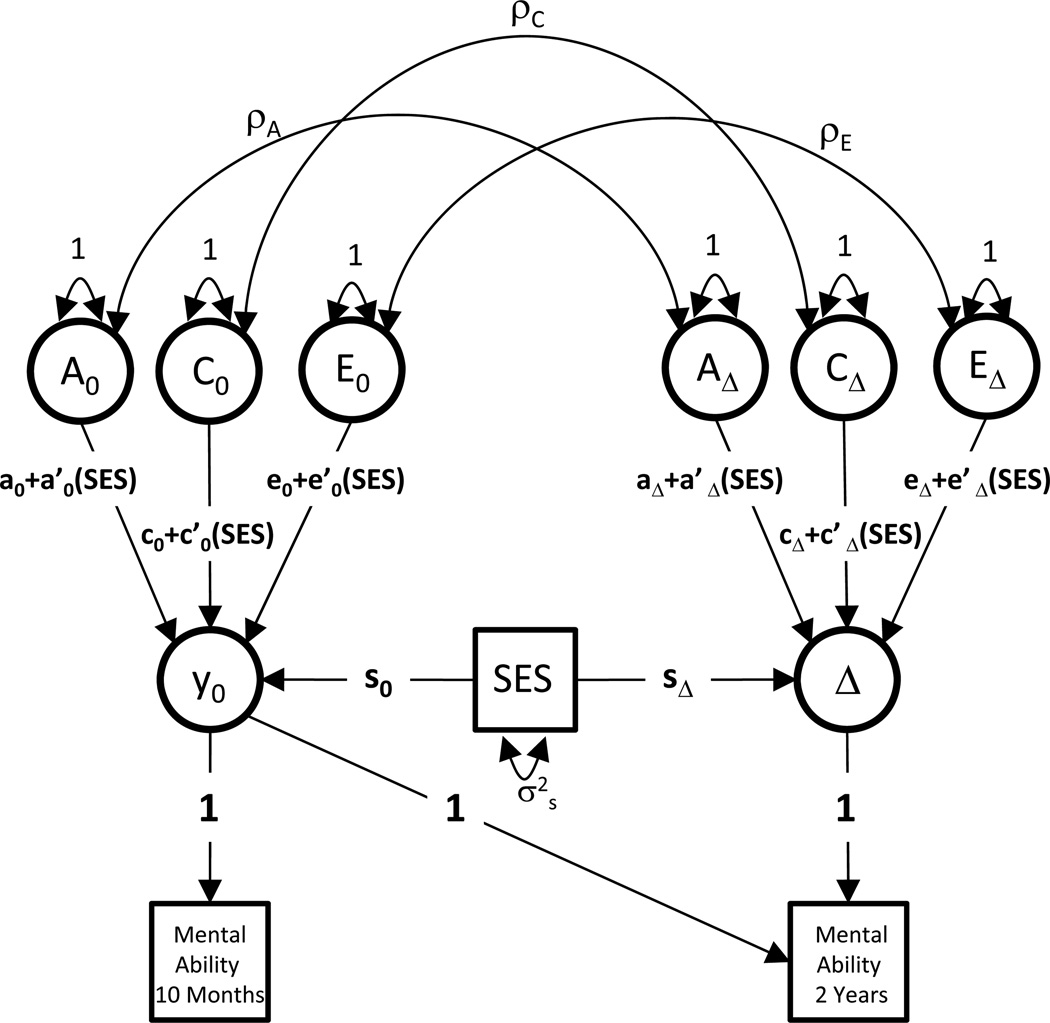
Figure 1.
Path diagram of the behavior genetic model (Model 3) fit to Bayley mental ability scores at 10 months and 2 years. This diagram represents one half of the model, i.e., one twin in each pair. A, C, and E are latent factors corresponding to additive genetic influences, environmental influences shared among twins (i.e. shared environment), and unique environmental influences (i.e. nonshared environment), respectively. The 0 subscripts denote the baseline wave of measurement (age 10 months), and the Δ subscripts denote the change between baseline and follow-up (age 2 years). Bayley scores at the second time point are modeled as a function of baseline scores plus change scores.

