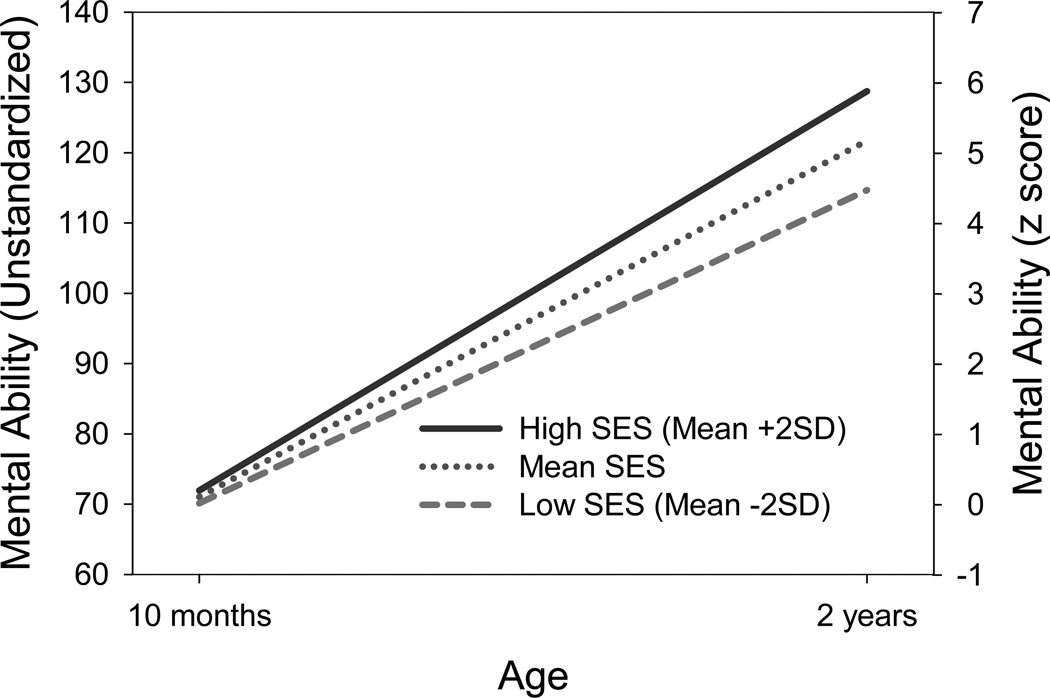
Figure 2.
Age trends in mental ability scores for low, mean, and high levels of socioeconomic status (SES). Based on parameter estimates from Model 1. The Y axis on the right is in the original units of the BSF-R. The Y axis on the left has been scaled relative to mean and standard deviation of mental ability at 10 months.

