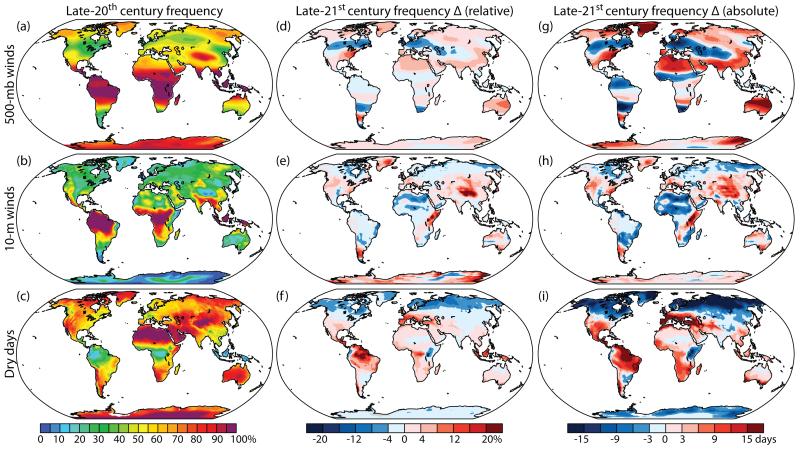
Figure 2.
Historic and future changes in simulated ensemble mean annual air stagnation components. (a-c) Late-20th century bias corrected stagnation components (percent of days/year). (d-f) Relative change of bias corrected air stagnation components, late-20th to late-21st century (percent change of days/year). (g-i) Absolute change of bias corrected air stagnation components, late-20th to late-21st century (days/year). Top row (a,d,g) is 500-mb winds, middle row (b,e,h) is 10-m winds, and bottom row (c,f,i) is dry day occurrence.

