
Figure 2.
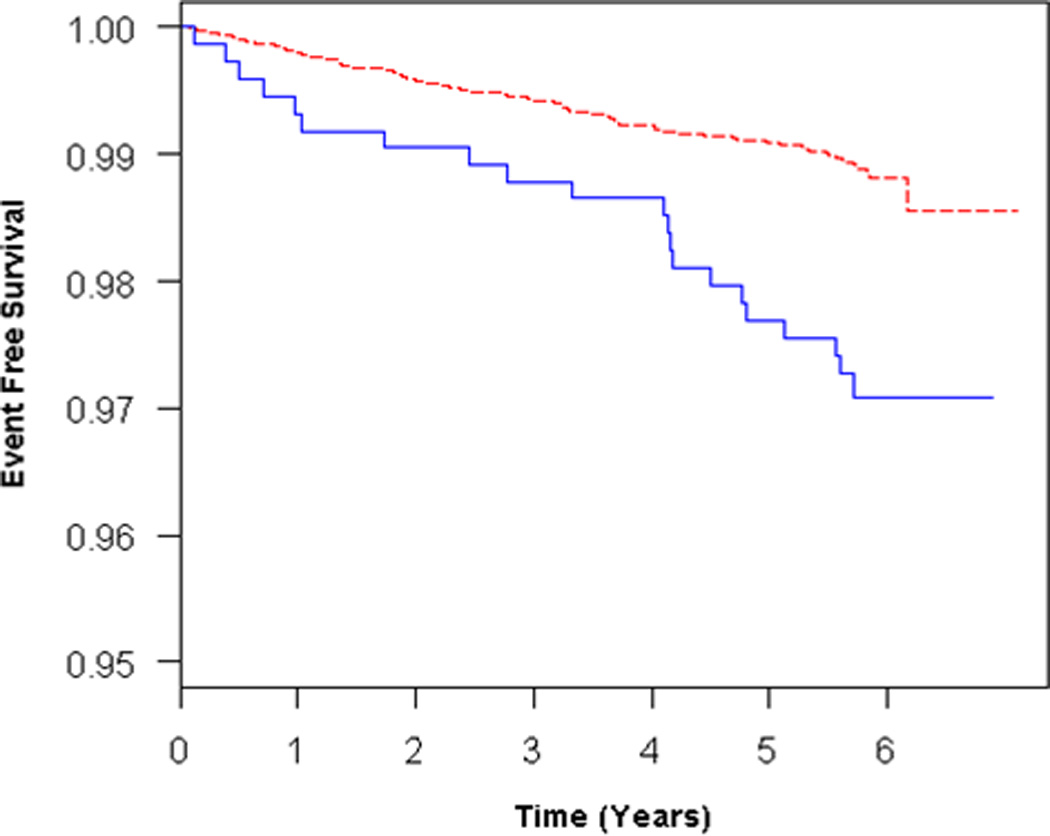
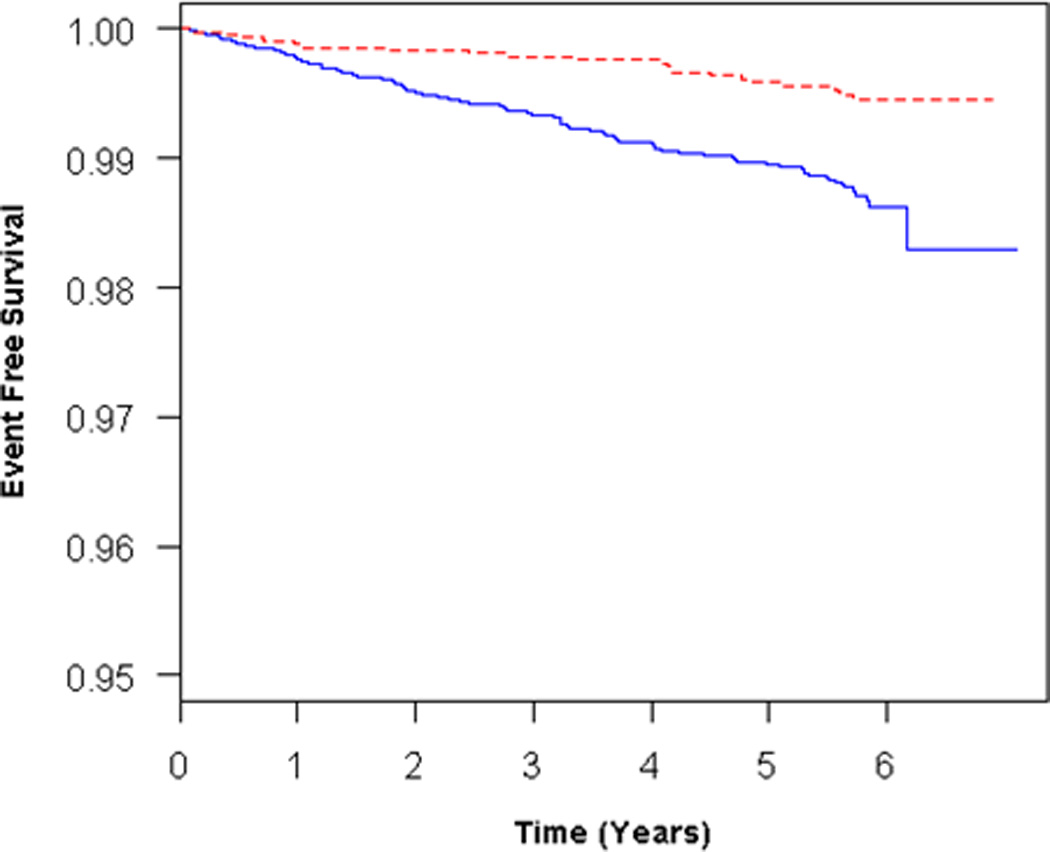
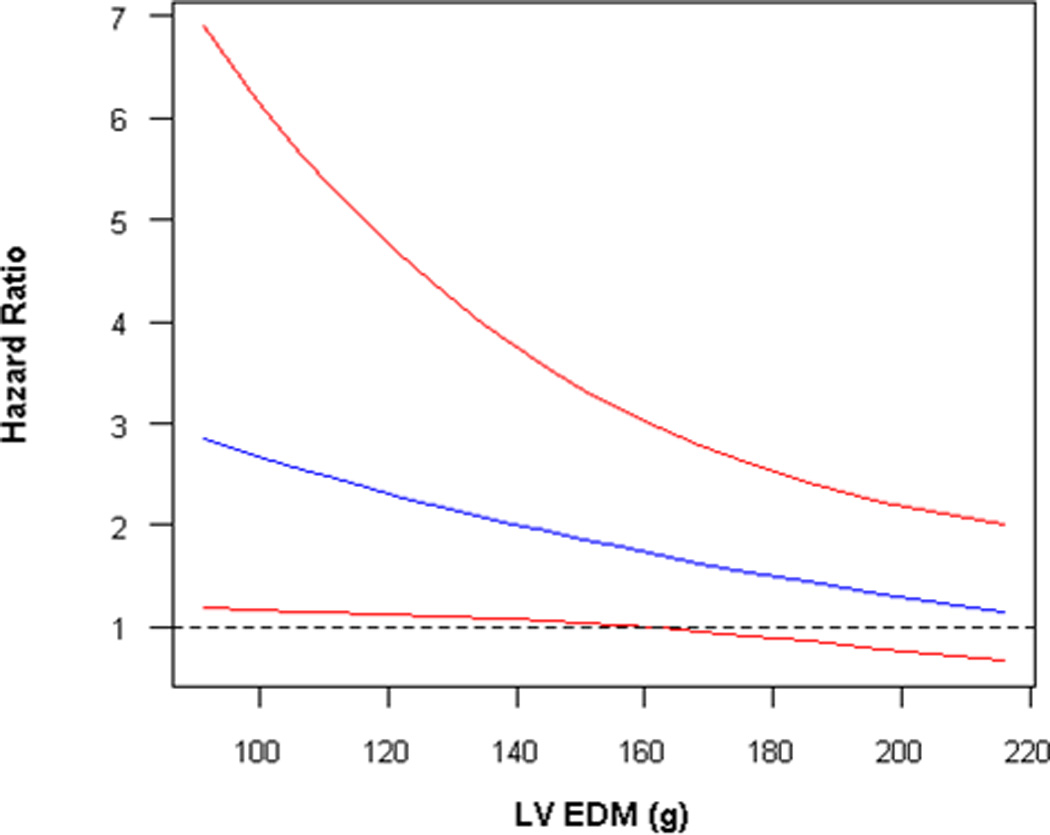
A) Adjusted survival curves for RV hypertrophy vs normal, adjusted for age, sex, race/ethnicity, BMI, education, CRP, hypertension, and smoking status, and B) Adjusted survival curves for RV hypertrophy vs normal, adjusted for all covariates + LV mass at mean LV mass (145 g). Solid blue = RV hypertrophy, dashed red = normal RV mass. C) Interaction of RV hypertrophy with LV mass in terms of the risk of HF or death. Solid blue = estimate, solid red = 95% confidence intervals.