
Figure 3.
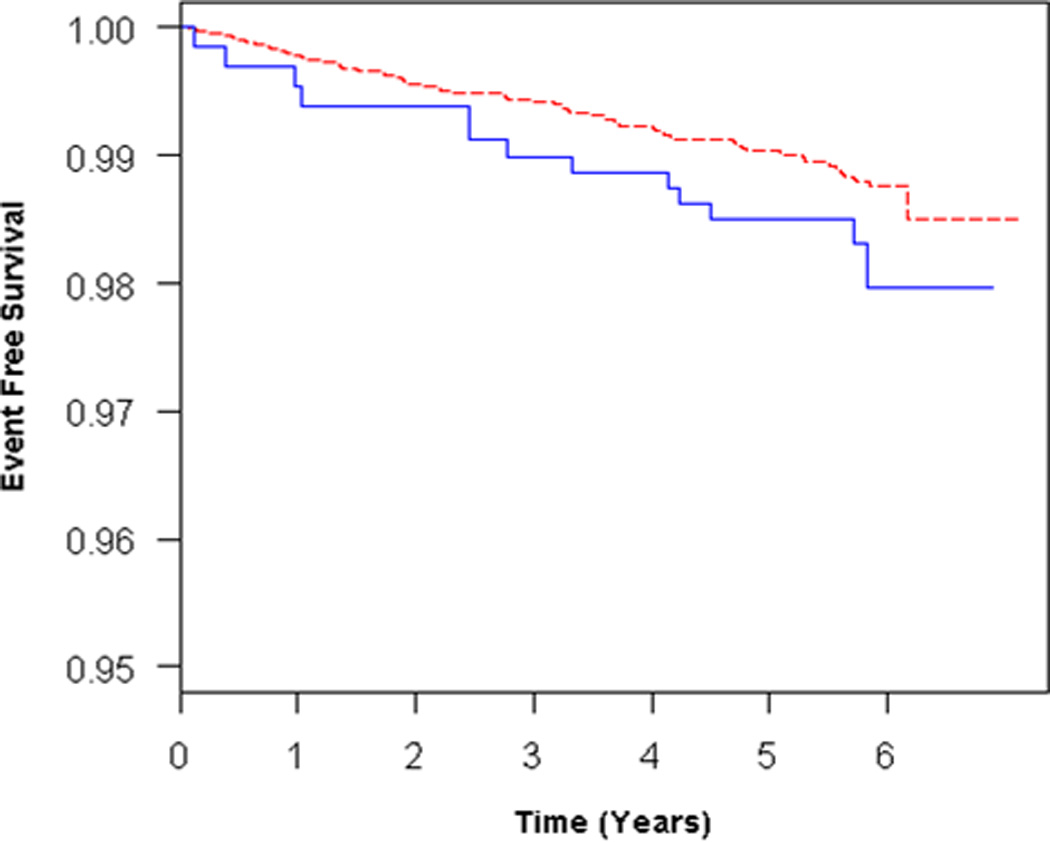
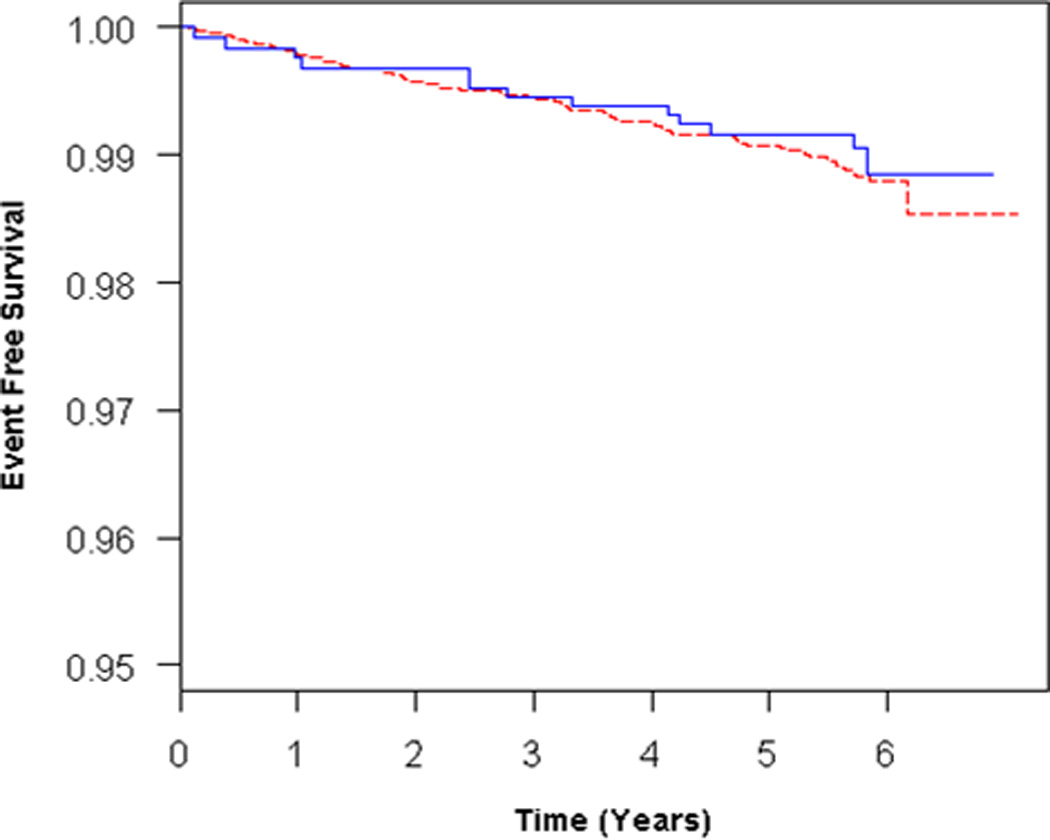
Adjusted survival curves for RV enlargement (RVEDV) vs normal, adjusted for A) age, sex, race/ethnicity, BMI, education, CRP, hypertension, and smoking status and B) all covariates + LVEDV. Solid blue = RV enlargement, dashed red = normal RVEDV.