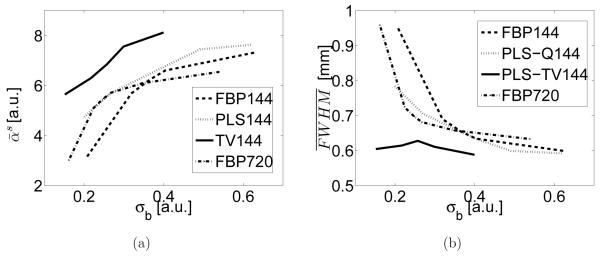
Figure 8.
(a) Signal intensity vs. standard deviation curves and (b) image resolution vs. standard deviation curves for the images reconstructed by use of the FBP algorithm from the 144-view data (FBP144), the PLS-Q algorithm from the 144-view data (PLS-Q144), the PLS-TV algorithm from the 144-view data (PLS-TV144), and the FBP algorithm from the 720-view data (FBP720).

