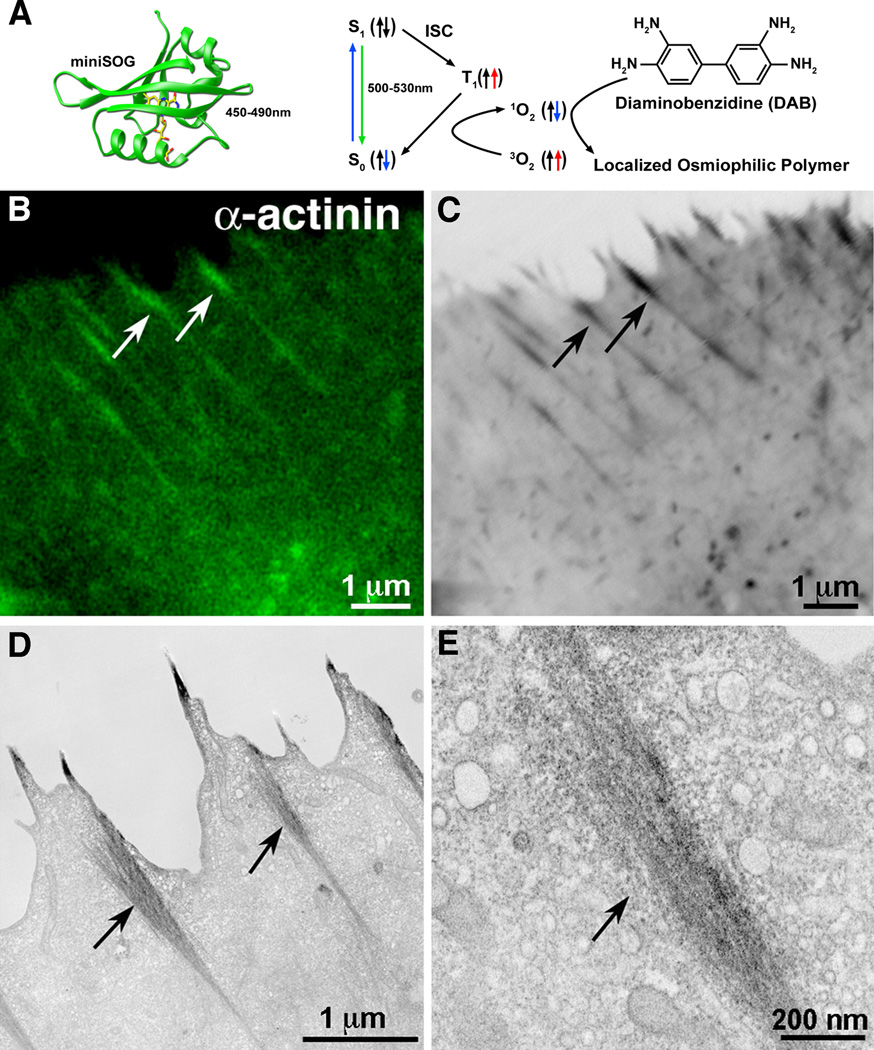
Figure 3. Fluorescence photooxidation of mini-SOG labeled α-actinin.
(A) Richardson diagram of miniSOG with FMN (left). The photooxidation process is shown in the right hand schematic. (B–E) miniSOG was genetically appended to the C-terminus of α-actinin. (B) Confocal microscope image of miniSOG fluorescence highlight actin bundles (C) Transmitted light micrograph of the same area after photooxidation. (D) Thin section EM of the same area. (E) Higher magnification of the actin bundle shows DAB precipitate surrounding labeled α-actinin. (Figure reproduced from Shu et al., (2011)).

