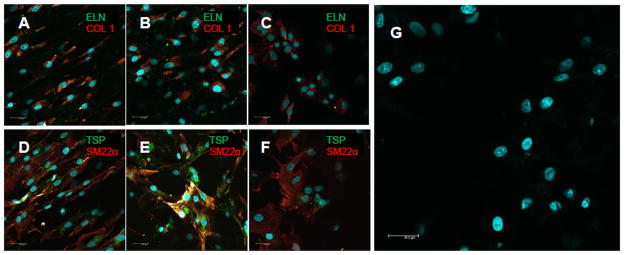
Figure 4.
Impact of substrate topography on RASMC phenotype and matrix production. Representative confocal images of RASMCs after 21 days on aligned meshes (A, D), random meshes (B, E, G), and spin-coated controls (C, F). The cells stained (green/red) for markers of both contractile (i.e. SM22α) and activated (i.e. thrombospondin (TSP)) SMC phenotypes. Cells cultured on meshes and controls also stained for collagen type 1 (COL 1, localized in the cell) and trace amounts of elastin (ELN). Image (G) is a representative negative immunofluorescent control that did not receive any primary antibodies. Cell nuclei were labeled with DAPI (blue).

