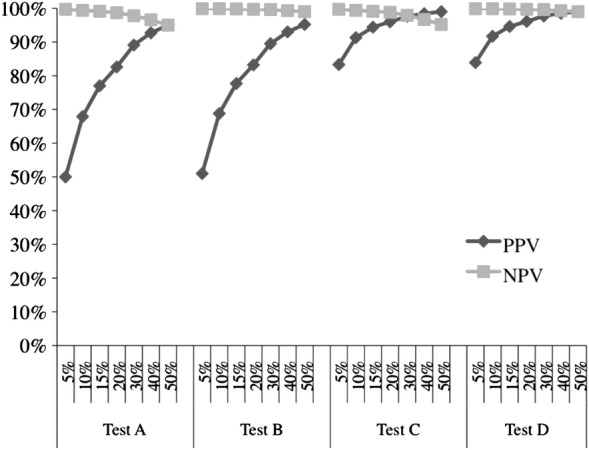
Figure 1.

Positive and negative predictive values of a test with the given sensitivity and specificity, stratified by population disease prevalence.**Percentages along the x-axis represent disease prevalence strata. NPV, negative predictive value; PPV, positive predictive value. Test A: sensitivity=95%, specificity=95%; Test B: sensitivity=99%, specificity=95%; Test C: sensitivity=95%, specificity=99%; Test D: sensitivity=99%, specificity=99%.
