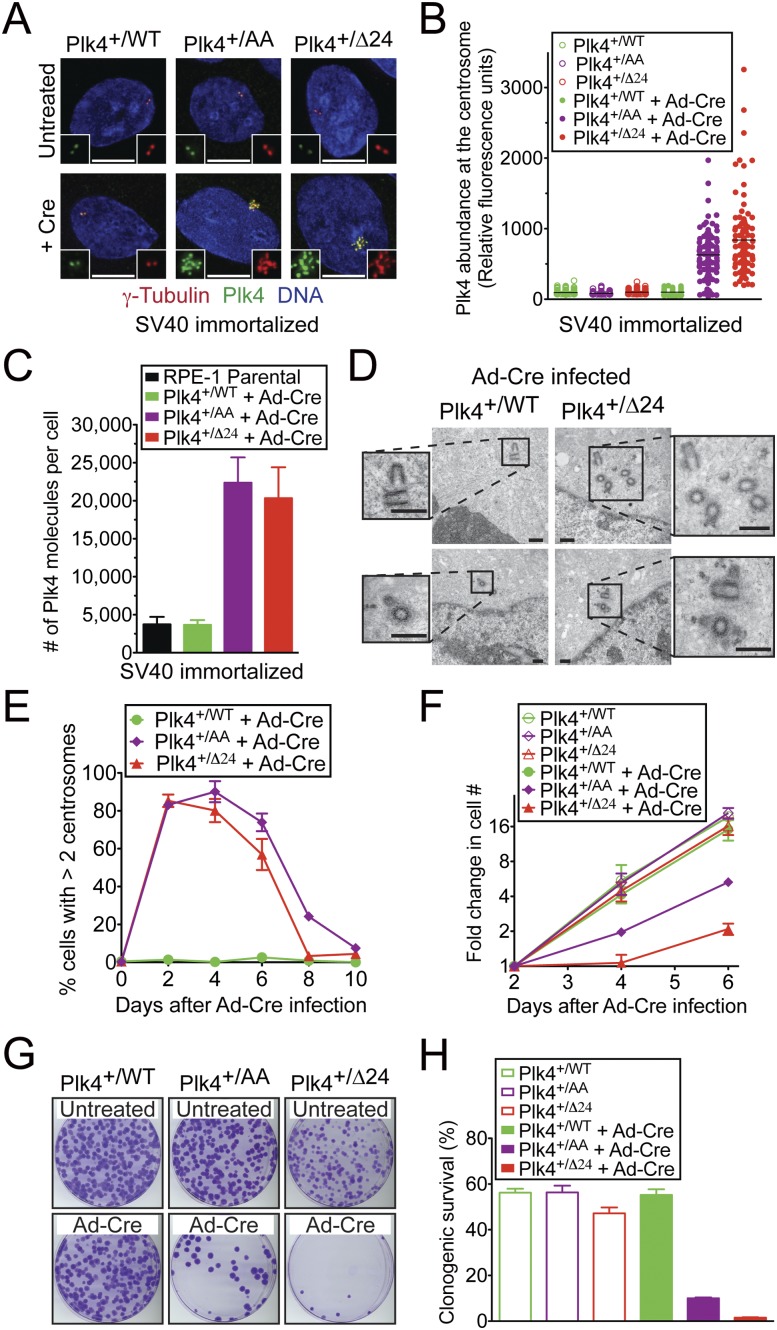
Figure 1.
The autoregulated destruction of Plk4 limits centrosome duplication to once per cell cycle. To allow for continued cell growth, cells analyzed in A–C express the SV40 large T-antigen; cells in D–H did not. (A) Images show the level of Plk4 at the centrosome. (Red) γ-Tubulin; (green) Plk4; (blue) DNA. Bar, 5 μm. (B) Quantitative immunofluorescence analysis of Plk4 levels at the centrosome. Points show the fluorescence intensity of individual cells from at least two independent experiments. The horizontal line represents the mean. (C) The number of Plk4 molecules per cell was determined using AQUA mass spectrometry. Bars represent the mean of at least two replicas. Error bars represent the standard deviation (SD). (D) Thin-section transmission electron micrographs of cells 2 d after infection with adenoviral Cre (Ad-Cre). Bar, 0.5 μm. (E) Fraction of cells with more than two centrosomes at various times after infection with Ad-Cre. Points show the mean of at least three independent experiments. Error bars represent the standard error of the mean (SEM). (F) Fold increase in cell number at various times starting 2 d after infection with Ad-Cre. Points show the mean of at least three independent experiments. Error bars represent the SEM. (G) Images of crystal violet-stained colonies. (H) Percent congenic survival of the indicated cells. Bars represent the mean of at least three independent experiments carried out in triplicate. Error bars represent the SEM.

