Figure 4.
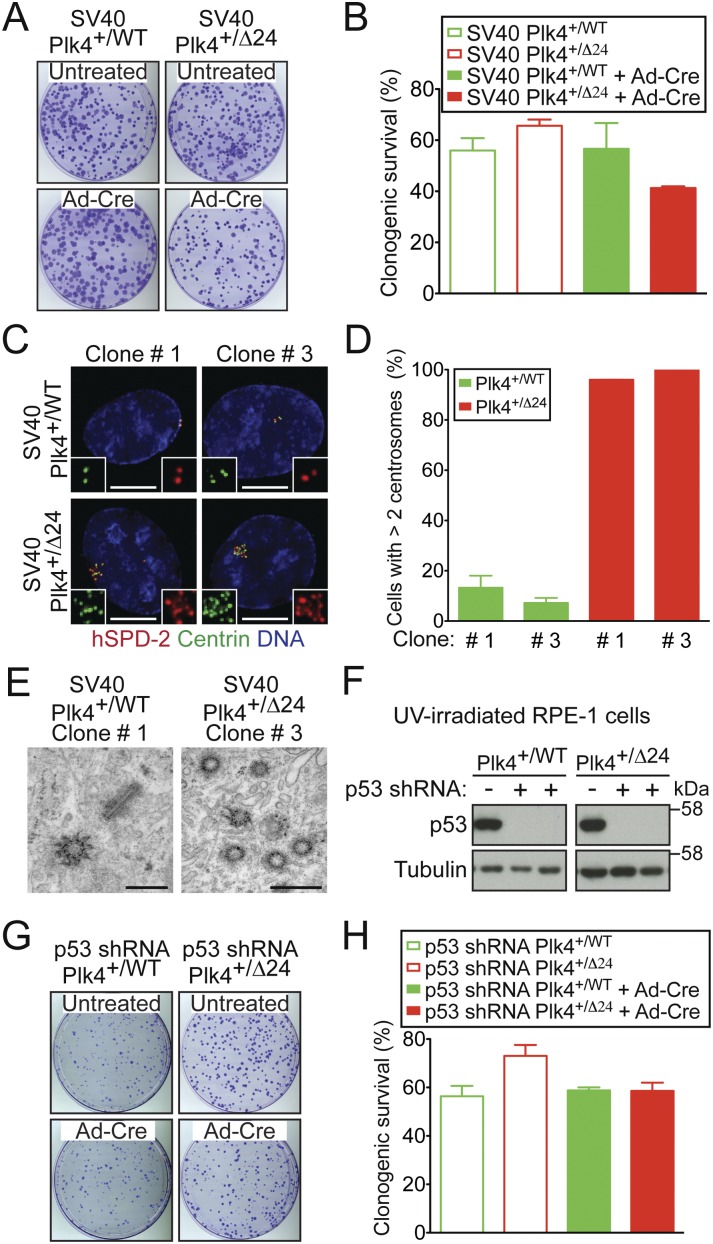
p53 inhibits the proliferation of cells defective in Plk4 autoregulation. (A) Crystal violet-stained colonies of the indicated cell lines. (B) Percent congenic survival for indicated cells. Bars represent the mean of at least two independent experiments carried out in triplicate. Error bars represent the SEM. (C) Images show the level of Plk4 at the centrosome of SV40-RPE1 clones that were isolated after infection with Ad-Cre. (Red) hSPD-2; (green) Centrin; (blue) DNA. Bar, 5 μm. (D) Fraction of SV40-RPE1 clones with more than two centrosomes. Bars represent the mean of at least two independent experiments, and error bars represent the SEM. (E) Thin-section transmission electron micrographs of SV40-RPE1 clones. Bar, 0.5 μm. (F) Immunoblots of p53 protein levels in UV-irradiated cells stably expressing a p53 shRNA. (G) Crystal violet-stained colonies of the indicated cell lines. (H) Percent clonogenic survival for the indicated cells. Bars represent the mean of at least two independent experiments carried out in triplicate. Error bars represent the SEM.

