Figure 3.
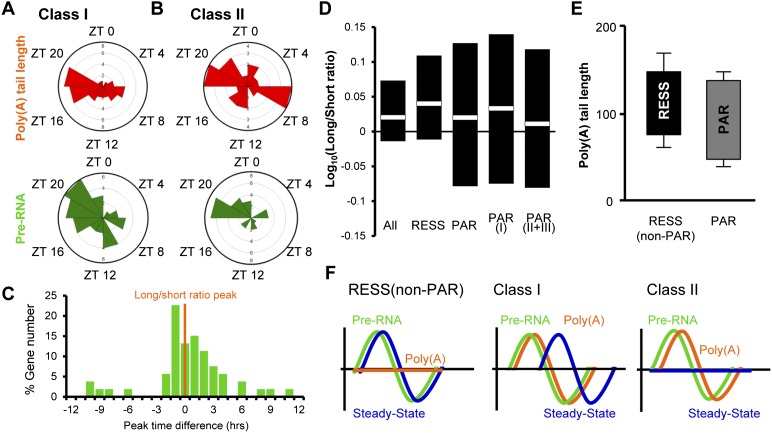
Rhythmic poly(A) tails of class I and II PAR mRNAs are the result of transcription-coupled poly(A) tail addition and slow deadenylation. (A,B) Peak phase distribution of the poly(A) tail length and pre-RNA expression of class I (A) or class II (B) mRNAs. (C) Distribution of peak time differences of pre-mRNA expression from the peak time of the long/short ratio of class I/II mRNAs from which the pre-mRNA level was measured. (D) The range and the average of the long/short ratio in different groups of mRNAs. The data from all time points were combined, regardless of the rhythmicity. Black bars represent the range (the top and the bottom of the black bars represent the average of the maximum and minimum of the long/short ratio of the day, respectively), while white boxes in the middle indicate the average of the ratio from all time points. (E) The range of poly(A) tails of 38 PAR and nine RESS (non-PAR) mRNAs. The top and bottom lines of each box represent the maximum and minimum poly(A) tail length (mean ± SEM). (F) Schematic representation of rhythmic characteristics of RESS (non-PAR) and class I and class II PAR mRNAs.

