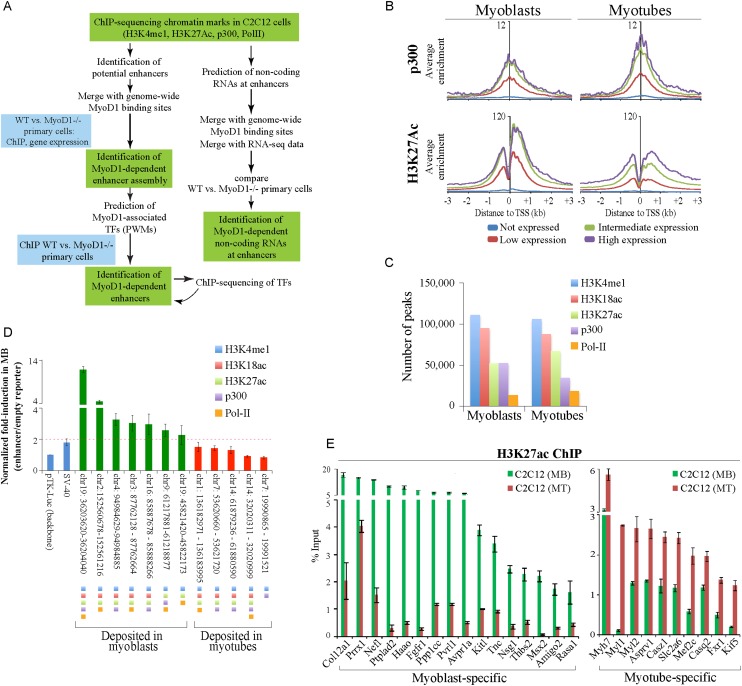
Figure 1.
Genome-wide identification of muscle enhancers. (A) Approach used to elucidate myogenic enhancers. (B) ChIP-seq analyses of p300 and H3K27ac indicate strong correlations with gene expression levels. The average ChIP-seq enrichment per 50-base-pair (bp) bin for the total population of genes in the four expression groups (see the Supplemental Material) was plotted with respect to the TSSs of coding genes. The Y-axis presents the average log2 enrichment value. (C) Distribution of enhancer-related peaks (triply marked) in myoblasts and myotubes. Peaks that satisfy the criteria for enhancer identification are depicted quantitatively as described in the Materials and Methods. (D) A series of putative enhancer regions were tested using a luciferase reporter assay. Genomic regions were marked by the indicated enhancer-related features. (E) qChIP was used to validate H3K27ac deposition at condition-specific enhancers associated with genes that were highly expressed in a condition-dependent manner. Enriched DNA was analyzed by quantitative PCR (qPCR). ChIP enrichment is shown as percent of input. Error bars depict the standard error of the mean (SEM) derived from three independent experiments. (MB) Myoblasts; (MT) myotubes.

