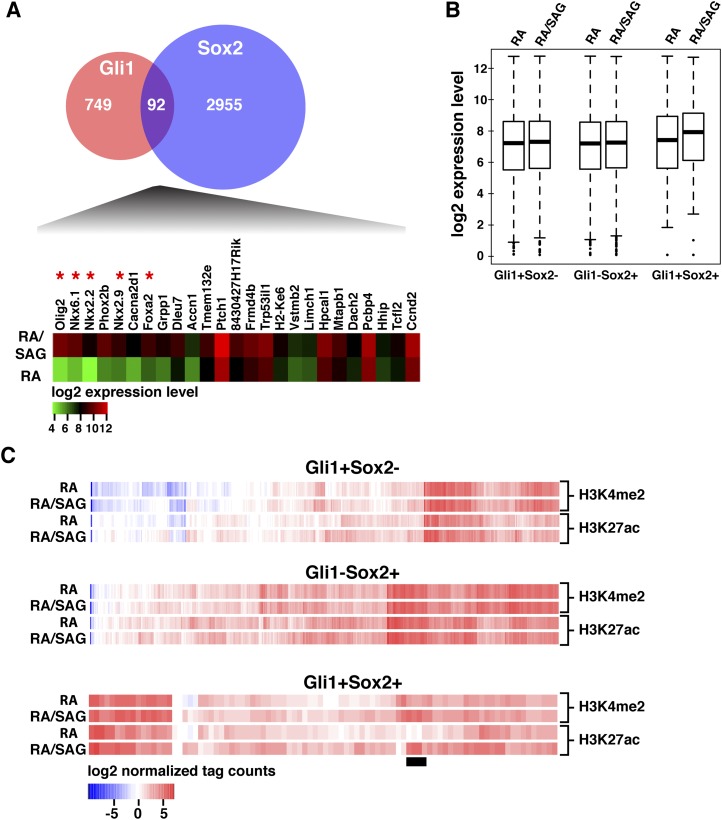
Figure 2.
Intersection and genomic analysis of Gli1 and Sox2 binding in neural progenitors. (A, top) Venn diagram for intersection of GBRs and Sox2-binding regions in neural progenitors. (Bottom) Heat map representation of genes that are differentially expressed in response to Shh pathway stimulation and also associated with Gli1- and Sox2-cobinding regions. Class II targets are marked by an asterisk (red). (B) Normalized expression values from the microarray are shown as box plots. (C) Region-based analysis comparing changes in H3K4me2 and H3K27ac levels with and without Shh pathway activation for regions bound by Gli1, Sox2, or both Gli1 and Sox2. Class II target regions are denoted by a black bar.

