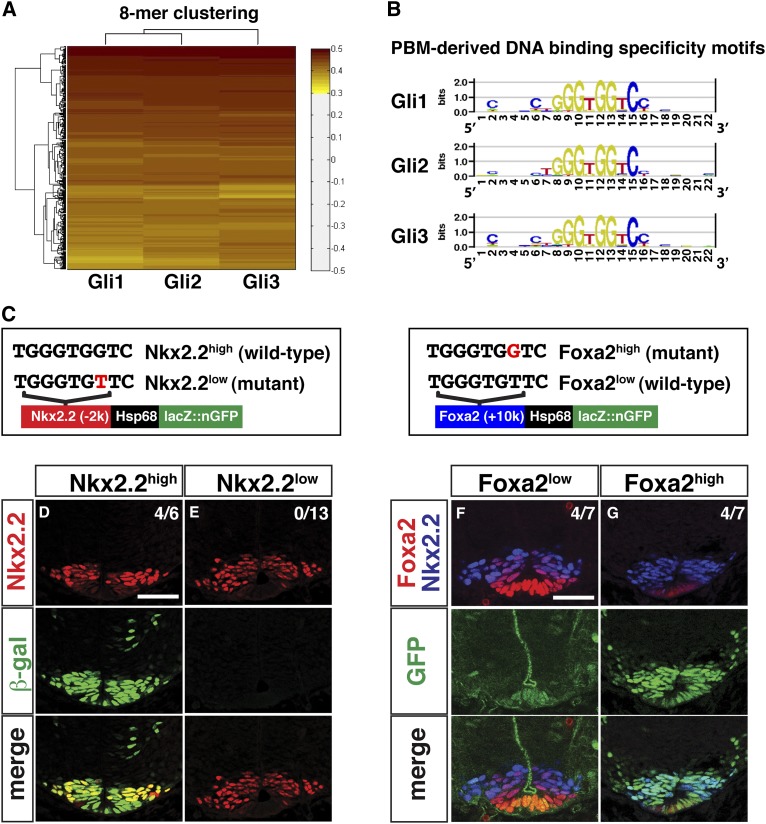
Figure 5.
Determination and functional characterization of intrinsic Gli-binding affinity. (A) Hierarchical clustering of bound probes in PBM data for Gli1–3. (B) Gli1–3-binding specificity motifs deduced from PBMs. (C) Reporter constructs with associated point mutations to the GBS are highlighted in red. (D–G) Transient transgenic reporter analysis performed at the forelimb level of E10.5 embryos. (D,E) Nkx2.2(−2kb) element with a high-affinity Gli site displays strong reporter activity compared with a low-affinity variant. (F,G) Foxa2(+10kb) element with a wild-type Gli site shows weak expression restricted to the most ventral cell population. The high-affinity variant shows a significant increase in GFP and extends to the dorsal limit of Nkx2.2. Bar, 50 μm.

