
Figure 7.
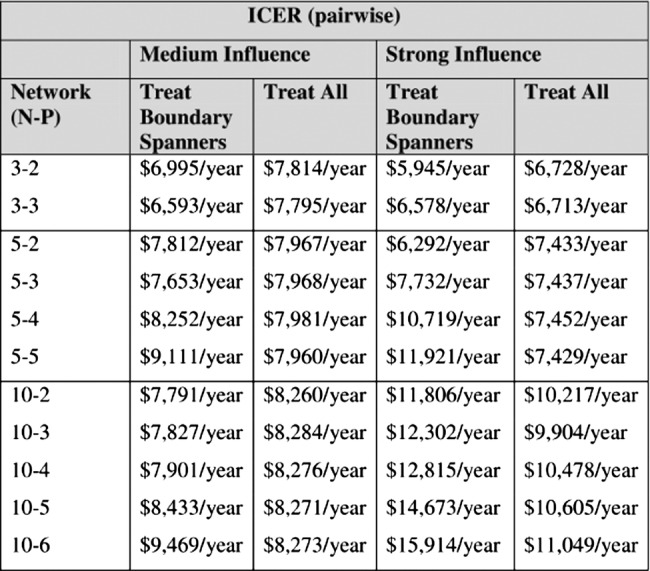
Effects of changing network structure (N–P denotes the structure where the maximum number of groups is N and the spanning threshold is P). The table depicts incremental cost effectiveness ratios relative to the baseline of no treatment.
Official websites use .gov
A
.gov website belongs to an official
government organization in the United States.
Secure .gov websites use HTTPS
A lock (
) or https:// means you've safely
connected to the .gov website. Share sensitive
information only on official, secure websites.
Effects of changing network structure (N–P denotes the structure where the maximum number of groups is N and the spanning threshold is P). The table depicts incremental cost effectiveness ratios relative to the baseline of no treatment.