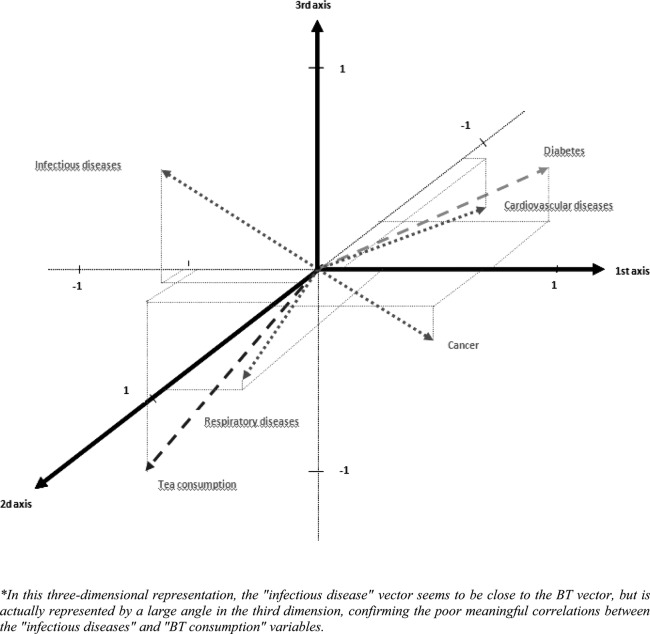
Figure 2.
Three-dimensional correlation circle of five health indicators and black tea (BT) consumption. In this three-dimensional representation, the ‘infectious disease’ vector seems to be close to the BT vector, but is actually represented by a large angle in the third dimension, confirming the poor meaningful correlations between the ‘infectious diseases’ and the ‘BT consumption’ variables.

