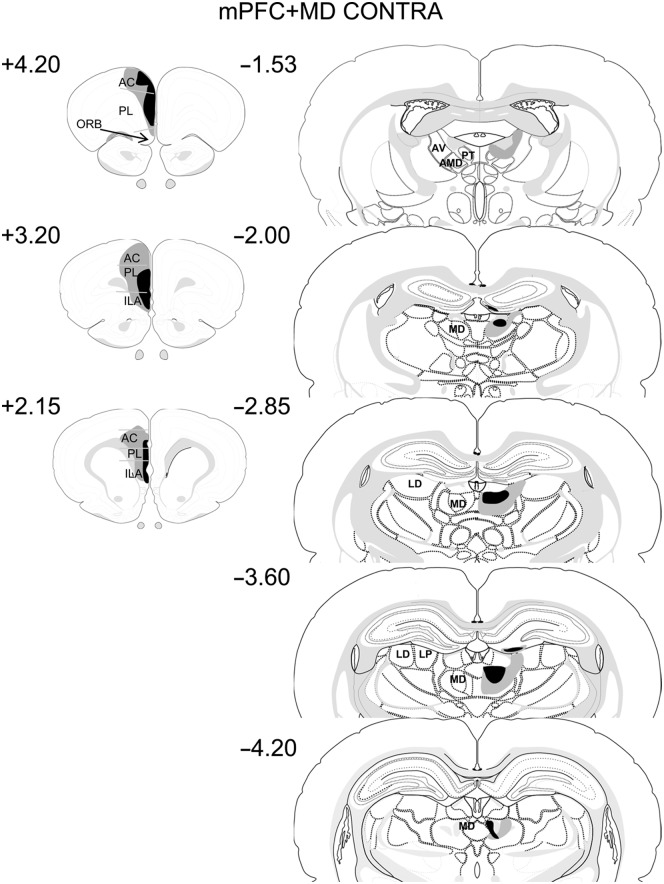
Figure 4.
Diagrammatic reconstructions showing the cases with the largest (gray) and smallest (black) lesions in the mPFC–MD Contra lesion group. The numbers correspond to the approximate position relative to bregma (Swanson 1998). (AC) anterior cingulate cortex; (AV) anteroventral thalamic nucleus; (AMD) anteromedial thalamic nucleus; (ILA) infralimbic cortex; (LD) lateral dorsal thalamic nucleus; (LP) lateral posterior thalamic nucleus; (MD) mediodorsal thalamic nucleus; (ORB) orbital frontal cortex; (PL) prelimbic cortex; (PT) parataenial nucleus.

