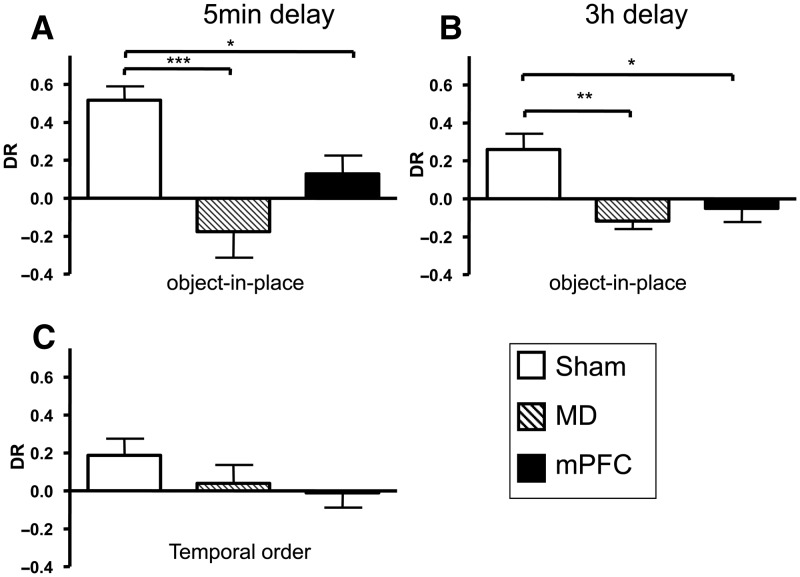
Figure 6.
Performance of bilateral MD and mPFC lesion groups in the object-in-place and temporal order memory tasks. (A) Object-in-place performance following a 5-min delay. (B) Object-in-place performance following a 3-h delay. (C) Temporal order memory performance. (*) P < 0.05, (**) P < 0.01, (***) P < 0.001. Shown for each group is the mean (±SEM) discrimination ratio (DR).

