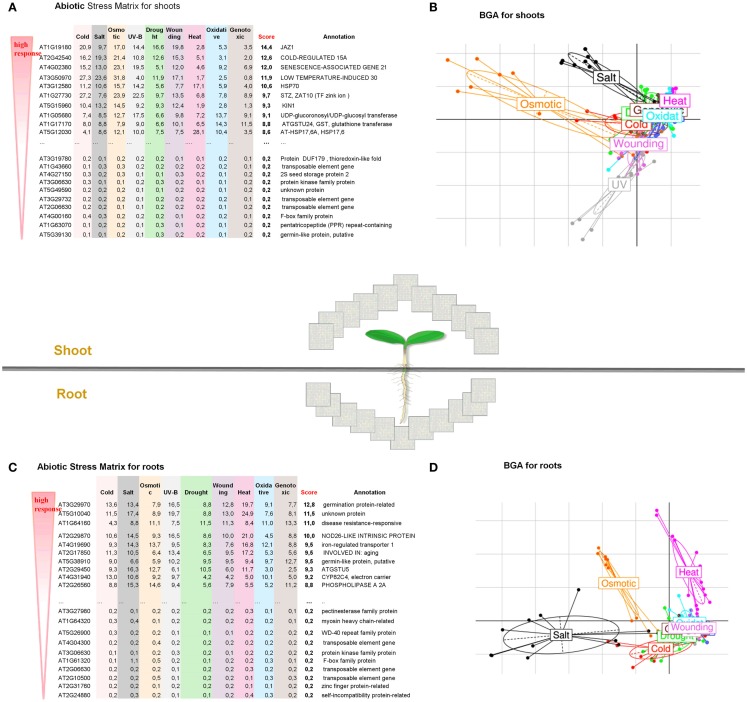
Figure 2.
Global overview of abiotic stress responses in roots and shoots of A. thaliana. Abiotic Stress Matrix for shoot (A) and root tissues (C). Values are calculated as a sum of absolute log-fold changes over all time points. The score is calculated as median over all abiotic stress conditions. Between Group Analysis for the whole transcriptome of shoot (B) and root (D). The larger distance between stress and control, the stronger the transcriptome reprograming under a given stress. Higher variance for shoots is noted for Osmotic > Salt > UV > Wounding. Higher variance for roots is noted for Salt > Osmotic > Heat.

