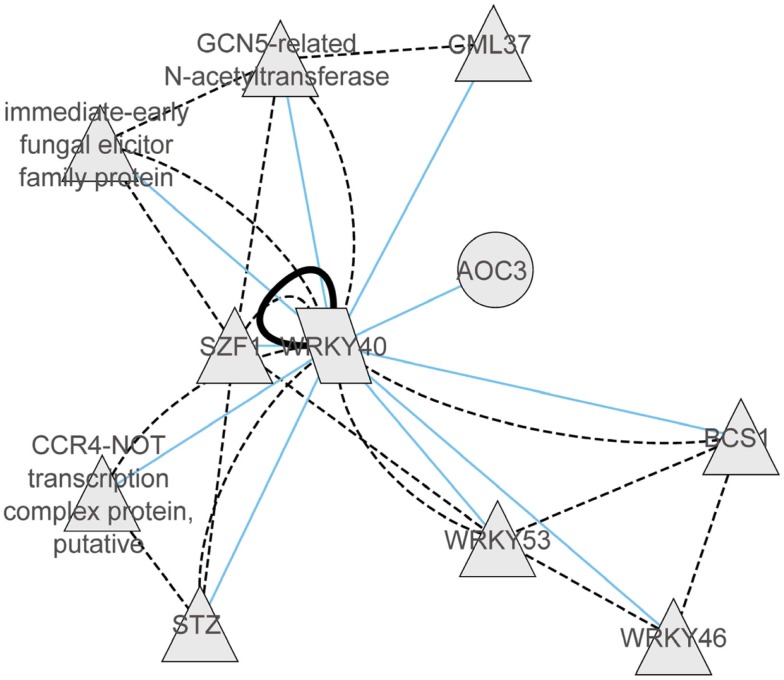
Figure 5.
Coexpression gene network and protein–protein interaction network of WRKY40 derived from CORNET database (De Bodt et al., 2012). Within the coexpression network blue lines represent correlations of >0.9. The protein–protein interaction network is represented by black solid lines (validated protein interactions) or by dotted black lines (predicted protein–protein interactions).

