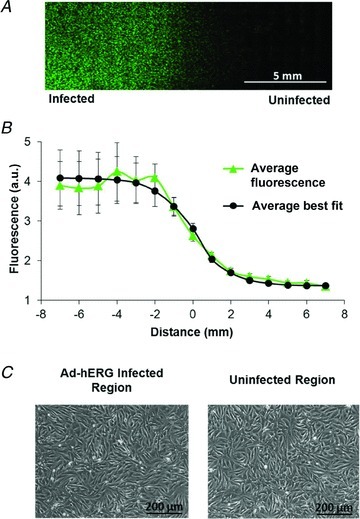
Figure 1. Spatial gradient in human ether-à-go-go-related gene (hERG) expression.

A, fluorescence image across 16 mm at the centre of a monolayer regionally overexpressing hERG with a GFP tag. B, average fluorescence gradient and best fit with a slope factor (dx) = 0.97 ± 0.12 mm (n = 6, x0 of best fit is set to 0). C, phase contrast images of infected and uninfected regions show full myocyte confluency and structural homogeneity.
