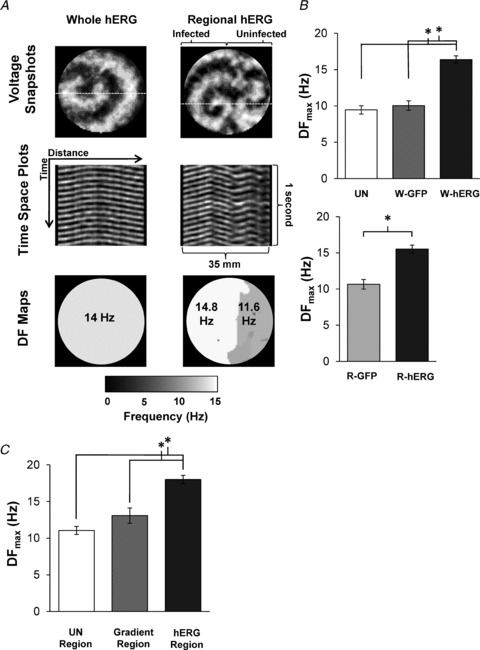
Figure 3. Rotor activity and propagation of waves.

A, top, snapshots of dominant rotors in W-hERG (left) and R-hERG monolayers (right). A, centre, time–space plots taken at the dashed lines in the snapshots. Uniform propagation in the whole-hERG monolayer (left), and 4:3 pattern in the R-hERG monolayer. A, bottom, dominant frequency (DF) maps. Note the 3.2 Hz gradient between infected and uninfected regions. B, DFmax values. There were no significant differences between uninfected (n = 12) and W-GFP (n = 4); however, both were significantly different from W-hERG (n = 45) *P < 5 × 10⁻⁹. The DFmax of R-hERG monolayers (n = 64) was significantly higher than for R-GFP monolayers (n = 7; P = 0.005). C, hERG gradient results in DFmax gradient. The DFmax in the Ad-hERG-infected region (n = 37) was at significantly higher frequencies than in the gradient (n = 12) and uninfected regions (n = 15); *P < 5 × 10⁻⁹.
