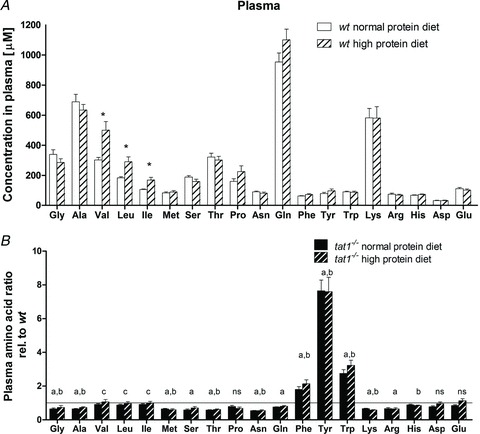
Figure 3. Free circulating AAs in plasma: effect of high protein diet in wt mice (A) and altered AA profile in tat1−/− (B).

A, absolute concentrations of AAs measured in plasma of wt mice subjected to normal (20%) and high (40%) protein diet. *P < 0.05. B, plasma AA concentrations in tat1 knockout mice are shown relative to the values measured for their wt littermates under the same diet. The horizontal line (y= 1) corresponds to the wt values. Represented are means ± SEM (n= 12). Groups were compared by one-way ANOVA, followed by Bonferroni post hoc test on selected pairs of columns. Values with letters are statistically different (P < 0.05): ‘a’ and ‘b’ indicate difference of tat1−/− versus wt under normal protein diet and high protein diet, respectively; ‘c’ indicates difference between normal protein and high protein diet in tat1−/− mice; ns, all comparison are not significant.
