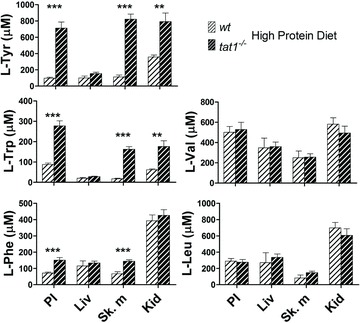
Figure 4. Concentrations of free AAs in plasma and cytosol of different organs.

PL, plasma; Liv, liver; Sk. m, skeletal muscles (i.e. m. gastrocnemius); Kid, kidney. Represented are means ± SEM (n= 6). **P < 0.01; ***P < 0.001 by unpaired Student's t test. More AAs can be found in Supplemental Fig. 6.
