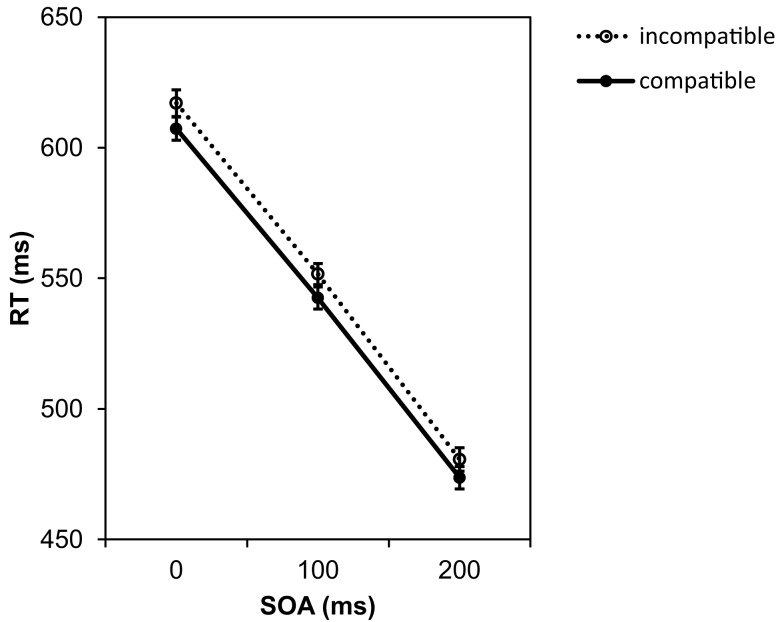
Figure 2.
Mean reaction times depending on SOA and compatibility conditions in Experiment 1. Error bars in this and all following graphs represent the standard error of the means calculated for the within-participant design following the procedure suggested by Cousineau (2005).

