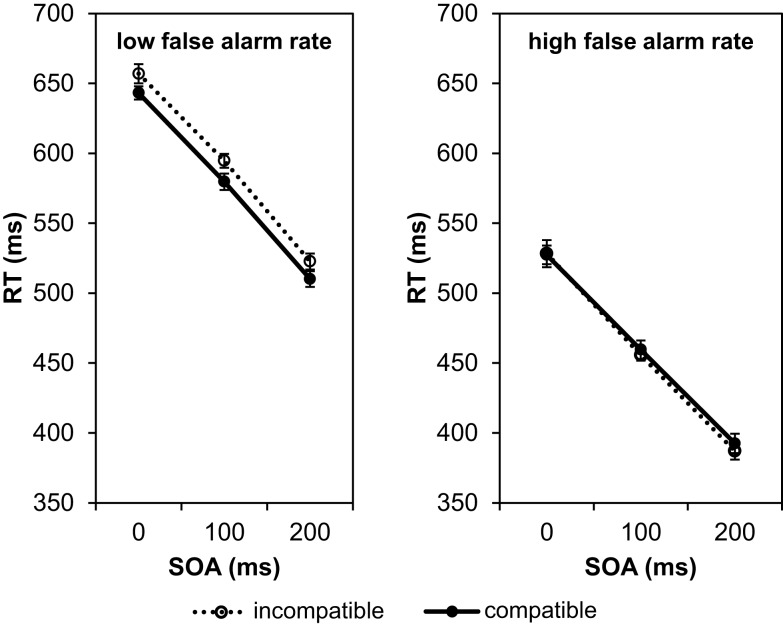
Figure 3.
Mean reaction times depending on SOA and compatibility conditions in Experiment 1. The left graph shows the result for participants with a low rate of false alarms (less than 20% responses in No-Go trials), the right graph for participants with a high rate of false alarms (more than 20% responses in No-Go trials).

