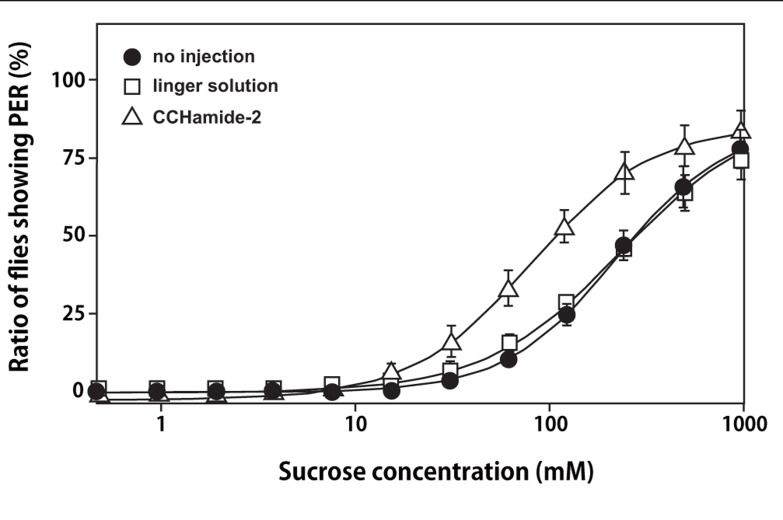
FIGURE 4.
Effect of CCHamide-2 on PER of the blowfly. Sigmoidal curves show the sucrose concentration–PER relationship for three fly groups: no injection (closed circle), injection with linger solution (open square), and injection of CCHamide-2 (open triangle). Each symbol on the line graph represents the mean ± SEM of data from five replicates for each experiment.

