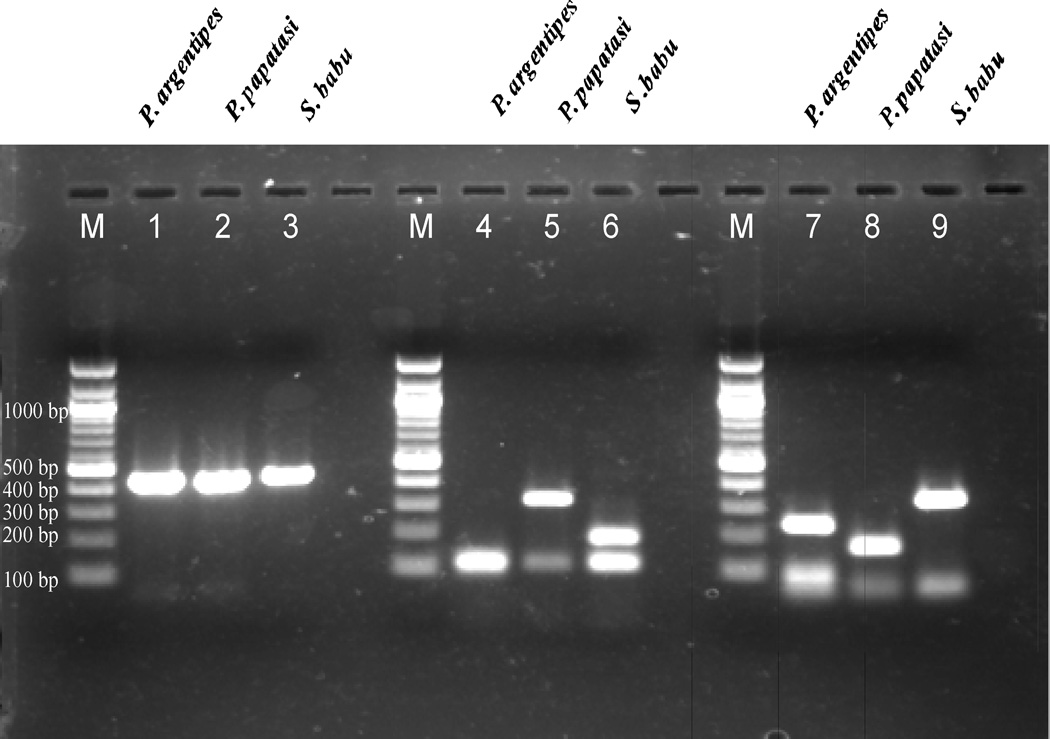
Fig. 2.
Agarose gel picture showing different digestion patterns for Hinf I and Hpa II. Lane 1–3: undigested PCR products for P. argentipes, P. papatasi and S. babu respectively. Lane 4–6: Hinf I digested products and lane 7–9: Hpa II digested products for the three sand fly species. (M: 100bp DNA ladder)

