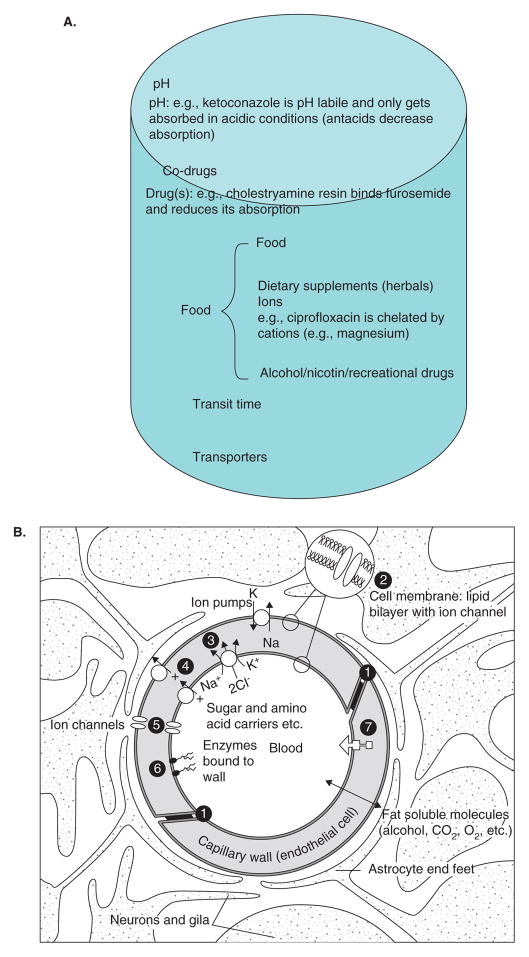
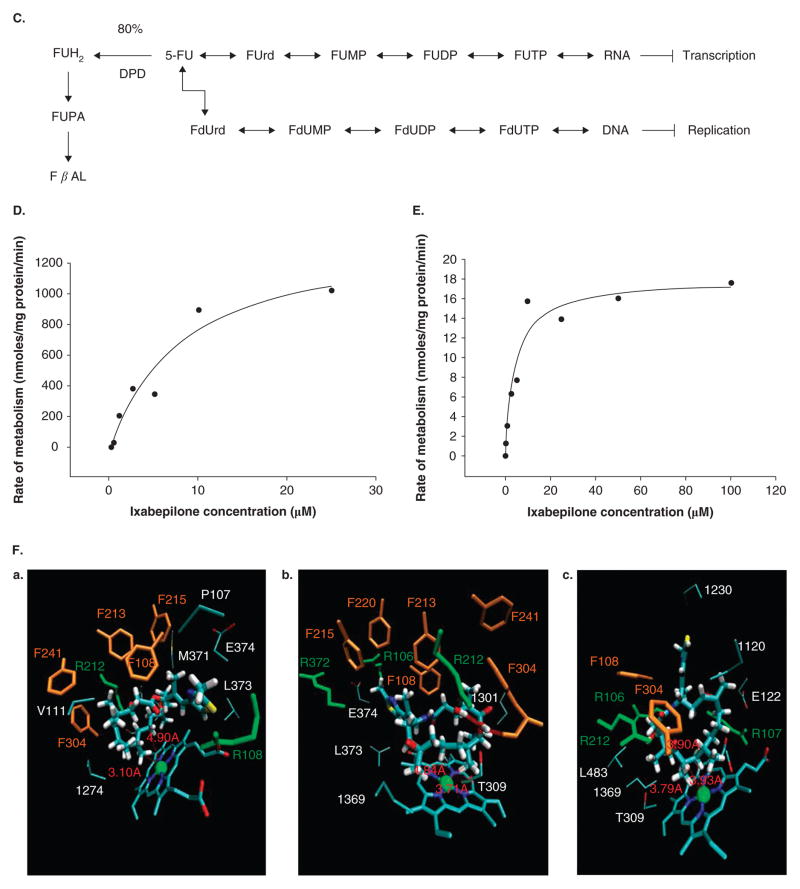
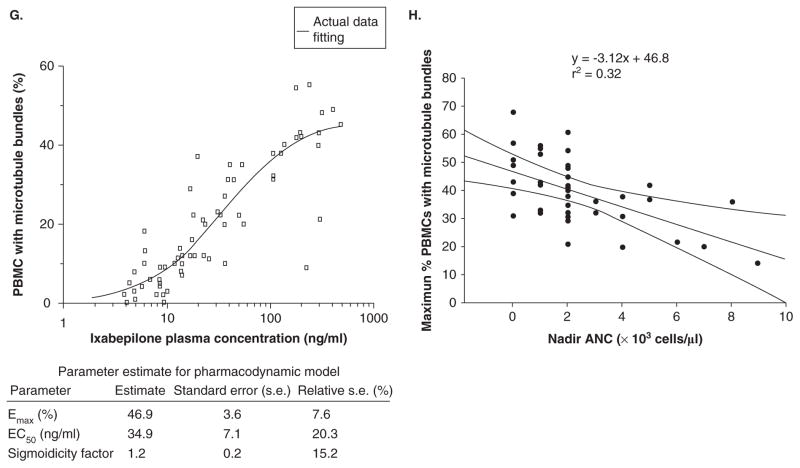
Figure 3. Mechanistic basis for drug interactions.
A. Factors affecting absorption and distribution of drugs. B. Components of the blood–brain barrier. Diagram of a cerebral capillary enclosed in astrocyte end-feet. Characteristics of the blood–brain barrier are indicated: (1) tight junctions that seal the pathway between the capillary (endothelial) cells; ii) the lipid nature of the cell membranes of the capillary wall that makes them a barrier to water-soluble molecules; (3i), (4) and (5) represent some of the carriers and ion channels; (6) the ‘enzymatic barrier’ that removes molecules from the blood; and vii) the efflux pumps that extrude fat-soluble molecules that have crossed into the cells. From http://answers.com/topic/blood-brain-barrier; courtesy Malcolm Segal. C. Enzymatic biotransformation pathway of 5-flourouracil and DPD. D. Concentration-dependent metabolism of ixabepilone in human liver microsomes. E. Concentration-dependent metabolism of ixabepilone in human cDNA expressed CYP3A4 enzymes F. Results of dynamic docking simulations: 3D representations of the two ligands docked into the active site of CYP3A4 after equilibration and minimization. The closest side chains of the vicinal residues (< 3.0 Å) are represented. Phenylalanine side chains belonging to the CYP3A4 phenylalanine cluster are displayed in orange, basic side chains (Arg) in green. a. Epothilone B; b. one docking mode of ixabepilone. For sake of clarity, the orientation of the representation has been changed with respect to panels a and c; c. the other docking mode of ixabepilone; b and c have similar docking energies according molecular mechanics calculations (see [42]). G. Relationship of percent PBMCs with microtubule bundles and ixabepilone plasma concentration (see [42]). H. Relationship between percent PBMCs with microtubule bundles and nadir ANC. The line describes a negative linear fit equation with r2 = 0.32 and curved lines represent 95% CI.
ANC: Absolute neutrophil count; DPD: Dihydropyrimidine dehydrogenase; FUH2: Dihydrofluorouracil; PBMC: Peripheral blood mononuclear cell.


