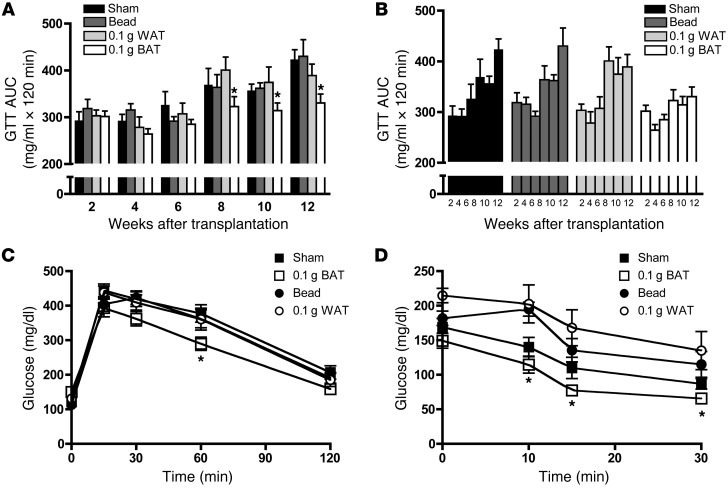
Figure 1. BAT transplantation improves glucose tolerance and increases whole body insulin sensitivity.
(A–C) Mice received transplants of 0.1 g BAT, a 0.15-g glass bead, or 0.1 g WAT or were sham operated. For glucose tolerance tests (GTT), mice were injected with 2 g glucose/kg body weight, i.p. (A and B) Glucose AUC and (C) GTT curve at 12 weeks after transplantation. (D) For ITTs, mice were injected with 1 U insulin/kg i.p. and data expressed as absolute glucose. Data are mean ± SEM. n = 5–8/group. *P < 0.05 between BAT-transplanted mice and all control groups.

