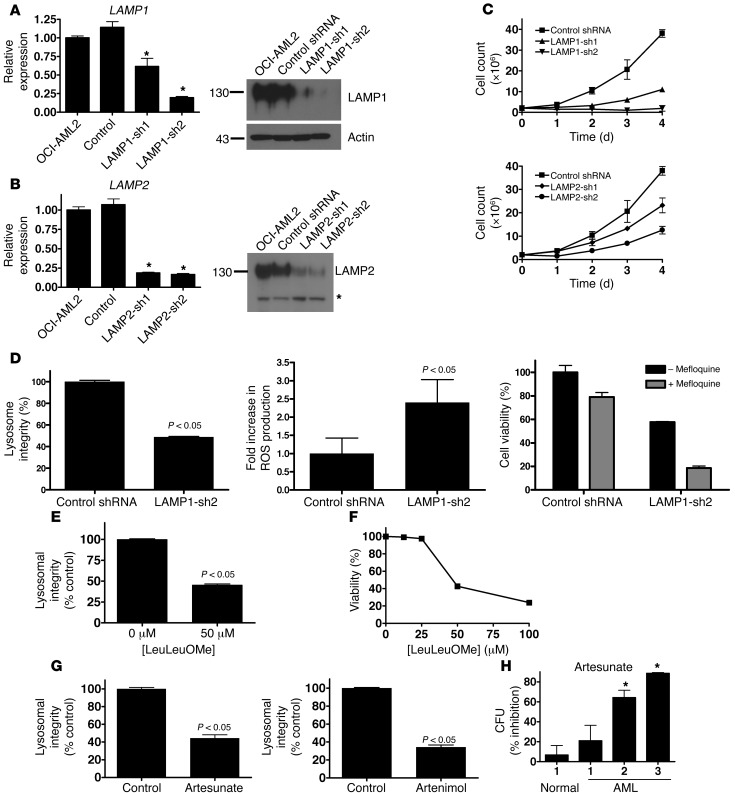
Figure 6. Genetic and chemical strategies to disrupt lysosomes have antileukemia effects.
(A) Left: Mean ± SD change in LAMP1 mRNA compared with untransduced controls after shRNA-mediated knockdown of LAMP1 (*P < 0.05). Right: LAMP1 and actin protein expression after shRNA-mediated knockdown. Molecular weights (kDa) are indicated. (B) Left: Mean ± SD change in LAMP2 mRNA compared with untransduced controls after shRNA-mediated knockdown of LAMP2 (*P < 0.05). Right: LAMP2 protein expression in isolated lysosomes after shRNA-mediated knockdown. Molecular weights (kDa) are indicated. Asterisk indicates nonspecific band. Equal protein loading was confirmed by Ponceau S staining. (C) Number of viable OCI-AML2 cells by trypan blue staining after shRNA-mediated knockdown of LAMP1, LAMP2, or control sequences. Data represent mean ± SD number of viable cells from 4 replicates in a representative experiment. (D) Mean ± SD lysosome integrity (acridine orange staining), ROS production (carboxy-H2DCFDA staining), and sensitivity to 8 μM mefloquine (MTS assay) after shRNA-mediated knockdown of LAMP1. Mean ± SD lysosome integrity (24 hours, LysoTracker staining) (E) and viability (48 hours, Annexin V staining) (F) in OCI-AML2 cells treated with LeuLeuOMe. (G) Mean ± SD lysosome integrity (LysoTracker staining) in TEX cells treated for 16 hours with 5 μM artesunate or artenimol. (H) Mean ± SD percent inhibition of clonogenic growth of primary AML and normal hematopoietic cells pretreated with 5 μM artesunate for 48 hours and then plated in clonogenic growth assays (*P < 0.05).

