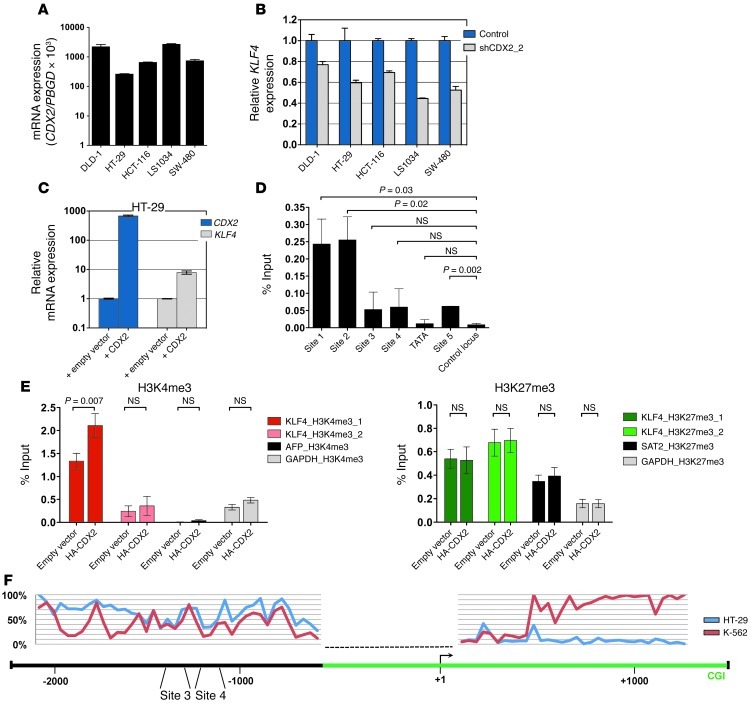
Figure 8. Relationship between CDX2 and KLF4 expression and analysis of the KLF4 regulatory region in human CRC cells.
(A) CDX2 mRNA expression of CRC cell lines. (B) Decreased KLF4 mRNA levels in response to CDX2 knockdown in human CRC cell lines. (C) Increased KLF4 mRNA levels in response to ectopic CDX2 expression in HT-29 cells. (D) ChIP showing occupancy of sites 1, 2 and (to a lesser extent) 5 in the KLF4 regulatory region by HA-CDX2 in HT-29 cells. The location of possible CDX2 binding sites is shown in Figure 2D. GAPDH served as control locus. (E) ChIP showing increased H3K4me3 enrichment and unchanged H3K27me3 occupancy in HT-29 cells upon expression of HA-CDX2. The location of the H3K4me3 and H3K27me3 marks is shown in Figure 2D. AFP and GAPDH served as negative and positive control loci for H3K4me3; GAPDH and SAT2 served as negative and positive control loci for H3K27me3. (F) Quantitative DNA methylation levels at the KLF4 locus in HT-29 cells and K-562 myeloid leukemia cells. The KLF4 TSS (+1) and CDX2 binding sites 3 and 4 are marked, and their relative positions are given. The green bar depicts a CpG island (CGI). The dashed line indicates a region where DNA methylation could not be assessed.

