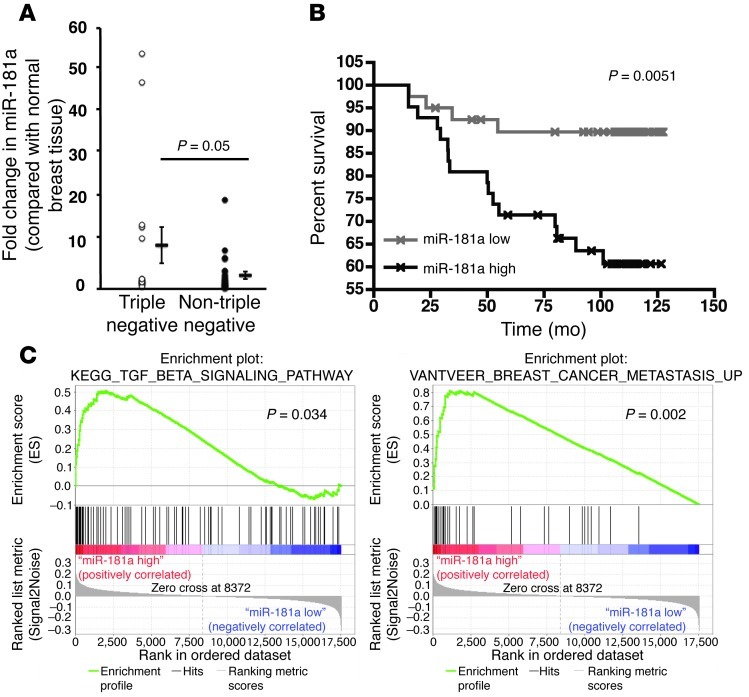
Figure 8. miR-181a is upregulated in TNBCs and corresponds to decreased overall survival times and increased metastasis in breast cancer patients.
(A) Semiquantitative real-time PCR of miR-181a expression in human TNBC (n = 16) as compared with other non-TNBC (n = 25) tumors. Expression levels of miR-181a were normalized to U6 levels and plotted as average fold change detected between the tumor and corresponding normal tissue. Data from 16 TNBC and 25 non-TNBC tumors, displayed as a dot plot alongside the mean ± SEM. P = 0.05. Student’s t test. (B) In an miR expression data set of 82 breast cancer patients that were negative for ErbB2 amplification (43), patients that possessed high tumor expression of miR-181a exhibited significantly reduced disease-free survival times. The median value for miR-181a was used to divide the samples into high (above the median) and low (below the median) miR expression, and the corresponding P value was calculated by log-rank analysis. (C) GSEA (GSE19783) plots for patients with breast tumors that were negative for ErbB2 amplification and expressed high levels of miR-181a demonstrated enrichment for the TGF-β signaling system (44, 45), and for the van’t Veer breast cancer metastasis signature (46).

