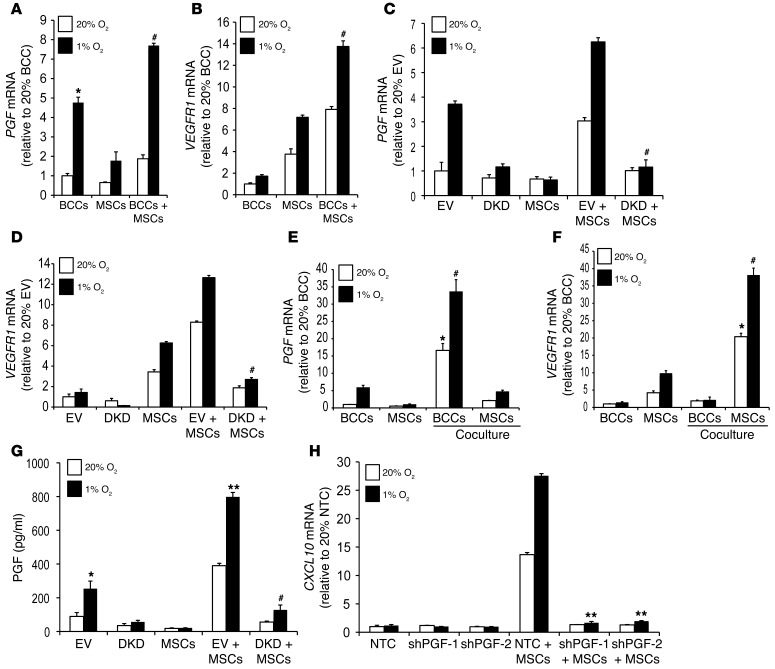
Figure 9. HIF regulates PGF and VEGFR1 expression and facilitates bidirectional signaling.
(A and B) BCCs, MSCs, or BCCs+MSCs were cultured at 20% or 1% O2 for 48 hours. PGF and VEGFR1 mRNA levels, determined by RT-qPCR, were normalized to those in BCCs at 20% O2. *P < 0.05 vs. 20% BCCs; #P < 0.01 vs. 20% BCCs+MSCs, ANOVA. (C and D) EV cells, DKD cells, MSCs, EV+MSCs, and DKD+MSCs were exposed to 20% or 1% O2 for 48 hours. PGF and VEGFR1 mRNA levels were normalized to those in BCCs at 20% O2. #P < 0.01 vs. 1% EV+MSCs. (E and F) GFP+ BCCs were cocultured with MSCs at 20% or 1% O2 for 48 hours, followed by FACS based on GFP fluorescence of BCCs and CD105 immunofluorescence of MSCs. RNA was extracted from flow-sorted cells for analysis of PGF and VEGFR1 expression. *P < 0.05 vs. 20% MSCs or BCCs alone; #P < 0.01 vs. 1% MSCs or BCCs alone. (G) CM was isolated from EV cells, DKD cells, MSCs, EV+MSCs, and DKD+MSCs cultured for 48 hours at 20% or 1% O2. ELISA was performed to determine PGF protein levels in CM (mean ± SEM; n = 3). *P < 0.05, **P < 0.001 vs. 20% EV; #P < 0.01 vs. 1% EV+MSCs, ANOVA. (H) NTC, shPGF-1, and shPGF-2 MDA-231 subclones were cultured alone or with MSCs at 20% or 1% O2 for 48 hours. CXCL10 mRNA expression was analyzed by RT-qPCR (mean ± SEM; n = 3). **P < 0.001 vs. 1% NTC+MSCs, ANOVA.

