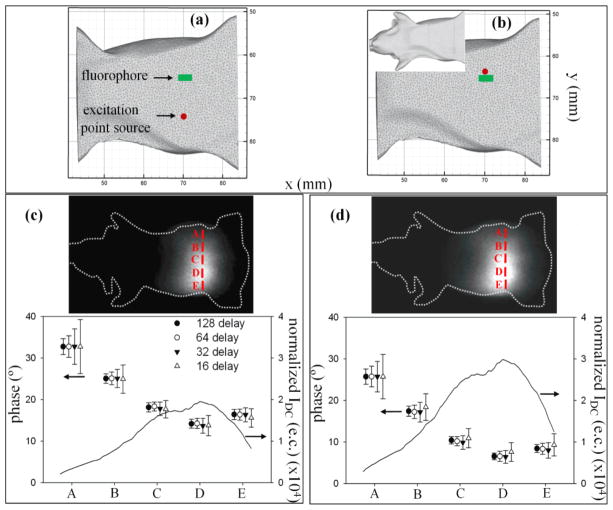
Figure 6.
Phantom measurements with benchtop setting. Figures (a) and (b) indicate the position of the excitation point source (red colored circle) at positions 1 and 2, respectively, on ventral side of the mesh-generated mouse-shaped phantom. The fluorophore location (green colored rectangle) is also shown. Inset to (b) shows the phantom orientation. Images of the emission signal collected from the dorsal side of the phantom can be observed in (c) and (d) along with the plots for normalized IDC, and STD in phase (θ) for different N (16, 32, 64, 128), corresponding to the source locations 1 and 2, respectively. The profiles are plotted along the line A-E that passes through the peak emission photon distribution.

