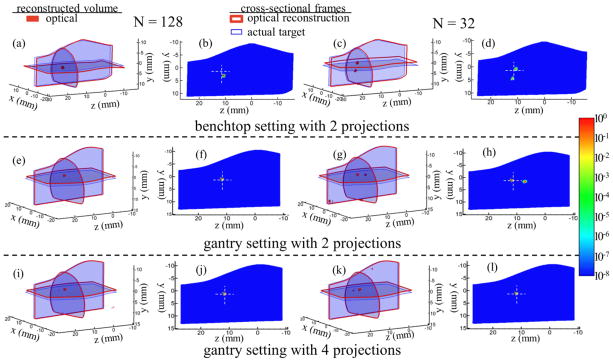
Figure 7.
Tomographic reconstructions using: (1) benchtop system (1st row, Figures a–d), and gantry installed system with (2) 2-projections (2nd row, Figures e–h) and (3) 4-projections (3rd row, Figures i–l). For brevity, reconstructions with only N = 128 and N = 32 are included. The 3D figures highlight the fluorophore localization within the reconstructed volume. Target localization errors are represented by the cross sectional frames with thin (blue color) and thick (red color) boundaries for 3D figures indicating the center position of the actual (CT derived) and optically reconstructed target, respectively. The volumetric mesh denotes the top 80% of the contour levels for the reconstructed fluorophore distribution. 2D slices show logarithmic intensity maps of the fluorophore along with the artifacts generated internal to the reconstructed volume. The cross-hairs on the 2D plots indicate the actual position of the fluorophore.

