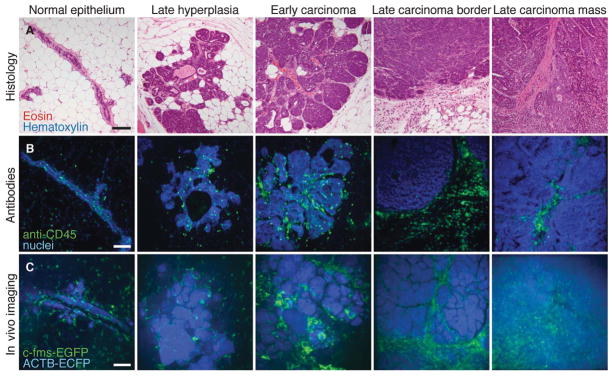
FIGURE 2.
Imaging tumor microenvironments in live mice. (A) Examples of hematoxylin- and eosin-stained sections of MMTV-PyMT tumors at different stages are shown together with a normal duct from a wild-type mouse. (B) Leukocytes identified by immunofluorescence (anti-CD45, green) in mammary tissue and MMTV-PyMT tumors (nuclei stained with propidium iodide and colored blue). (C) Different tumor microenvironments within live MMTV-PyMT;ACTB-ECFP;c-fms-EGFP mice. The normal duct is from a live ACTB-ECFP;c-fms-EGFP mouse. Myeloid cells are green (c-fms-EGFP), and all cells are labeled blue (ACTB-ECFP). Images are maximum intensity projections. Scale bars, 100 μm. (Adapted from Egeblad et al. 2008.) (For color figure, see doi: 10.1101/pdb.top97 online at www.cshprotocols.org.)

