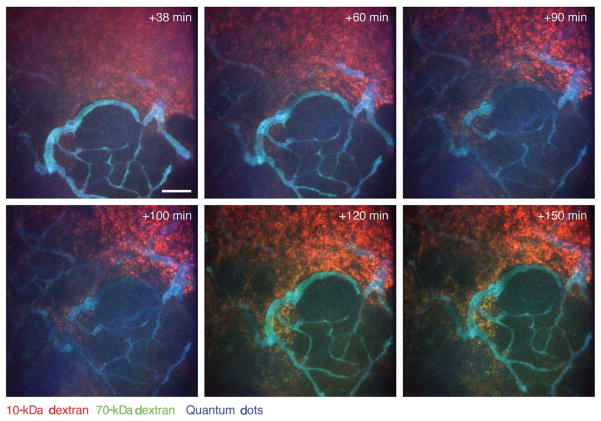
FIGURE 9.
Dynamics of vascular leakage in neoplastic tissue followed by intravital imaging. Leakage of high-molecular-weight (70 kDa; green) and low-molecular-weight (10 kDa; red) dextrans into a late-stage carcinoma in an MMTV-PyMT mouse is shown. The dextrans were injected intravenously together with nontargeted quantum dots (blue) that did not leak during the imaging period (the tumor tissue is not labeled); a minimal amount of high-molecular-weight (green) dextran leaked during early time points, but it is seen colocalized with the low-molecular-weight (red) dextran (resulting in yellow) at later time points. Images are shown at indicated times after intravenous injection. Maximum intensity projections. Scale bar, 100 μm. (For color figure, see doi: 10.1101/pdb.top97 online at www.cshprotocols.org.)

