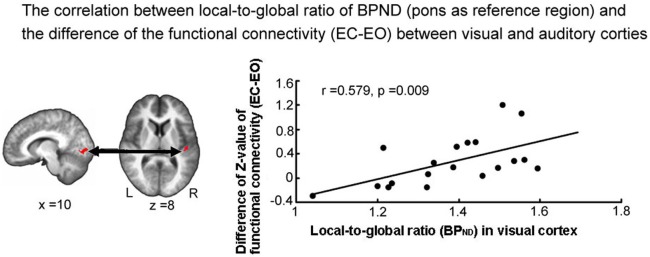
Figure A4.
The functional connectivity difference (EC minus EO) correlated with local-to-global ratio of BPND (pons as reference region) of GABAA receptor in visual and auditory cortex (r = 0.579, p = 0.009 uncorrected). Fisher's Z-transformation was used to translate the R-value of the correlation between visual and auditory cortex time series to a normally distributed Z-value.

