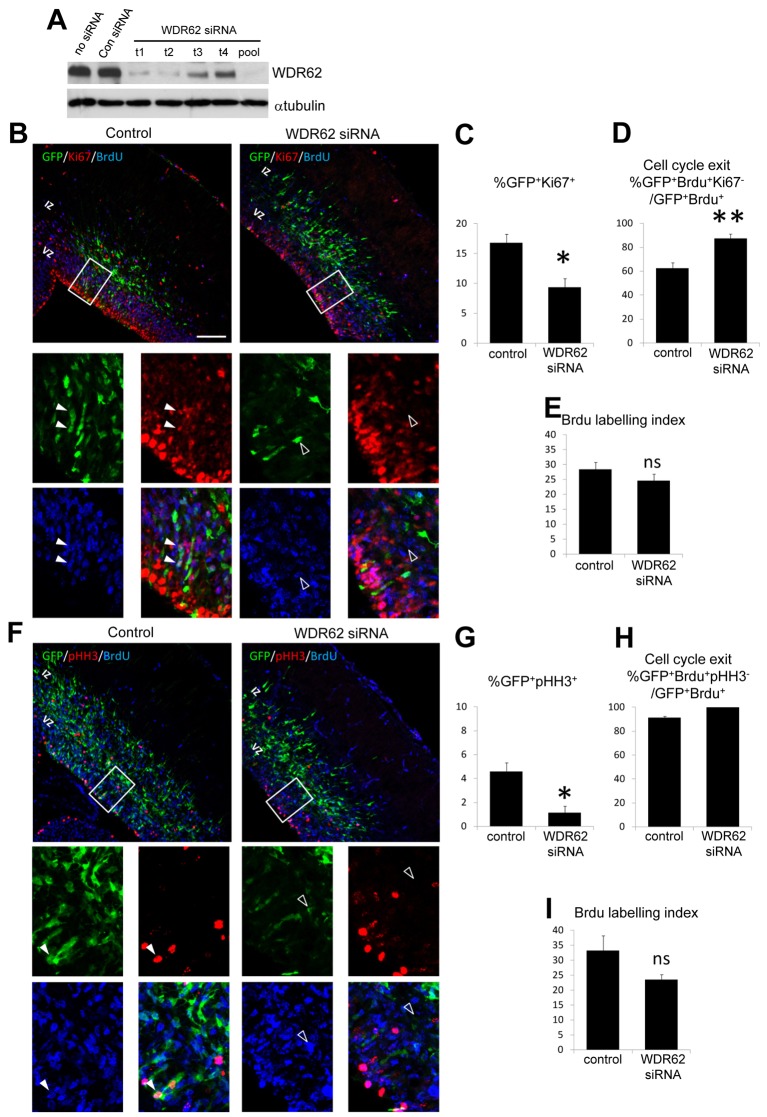
Fig. 1.
WDR62 depletion decreased cell proliferation within the embryonic cortex. (A) Neuro2a cells were transfected with individual mouse WDR62-targeting siRNA (t1, t2, t3 and t4), a combined mouse WDR62 siRNA pool, non-targeting siRNA (Con siRNA) or not treated with siRNA (no siRNA) and immunoblotted for WDR62 and α-tubulin. (B) Images of the coronal sections of embryonic mouse cerebral cortex electroporated with control or mouse WDR62 siRNA, together with GFP to label electroporated cells. Embryos were pulse labeled with BrdU 24 h post-electroporation, and brain sections finally stained for Ki67 to identify actively proliferating cells at time of harvest (48 h post-electroporation). Magnified panels (below) of the ventricular zone (VZ) highlight proliferating (GFP+/BrdU+/Ki67+, filled arrowheads) and non-proliferating cells (GFP+/BrdU+/Ki67−, open arrowheads). (C) Quantification of cell proliferation (GFP+/Ki67+) in brain sections from control and mouse WDR62-siRNA-treated embryos. (D) The cell cycle exit index in response to WDR62 depletion was determined by counting GFP+/BrdU+/Ki67− cells and expressing this as a proportion of GFP+/BrdU+ cells. (E) BrdU labeling index in control and WDR62-siRNA-treated brain sections used in the analysis depicted in B. (F) Coronal sections of embryos electroporated with control or mouse WDR62 siRNA were stained for phospho-histone H3 (pHH3). Magnified panels (below) of the VZ highlight cells in M phase (GFP+/BrdU+/pHH3+, filled arrowheads) and non-mitotic cells (GFP+/BrdU+/pHH3−, open arrowheads). (G) The mitotic index in response to WDR62 depletion was determined by the proportion of cells double labeled for GFP and pHH3 (GFP+/pHH3+). (H) A cell cycle exit index analysis performed with pHH3 and BrdU immunostaining was determined by counting GFP+/BrdU+/pHH3− cells within the population of GFP+/BrdU+ cells (statistical analysis could not be performed because 100% of cells were GFP+BrdU+pHH3− following WDR62 siRNA treatment). (I) BrdU labeling index in control and WDR62-siRNA-treated brain sections used in the analysis depicted in (F). Scale bar: 100 µm, while all graphs plot means ± s.e.m. (*P<0.05, **P<0.01, ns denotes not statistically significant).

