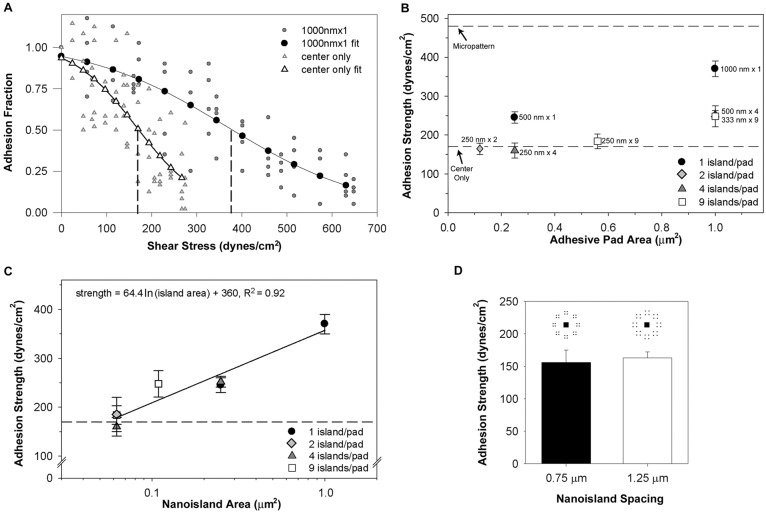
Fig. 4.
Nanoscale adhesive geometry regulates cell adhesion strength. Cell adhesive force to FN nanopatterns was measured using a spinning disk assay. (A) Detachment profiles (adhesive fraction versus shear stress) for cells adhering to 1000 nm×1 and center-only patterns. Experimental points were fitted to a sigmoid curve to calculate the shear stress for 50% detachment, which represents the mean adhesion strength. Vertical dashed lines show the shear stress for 50% detachment for each profile. (B) Adhesion strength as a function of adhesive pad area for different nanoisland configurations. Values are means ± s.e.m. The top and bottom dashed lines correspond to the adhesion strengths for a 10 µm diameter circular area and the center-only pattern, respectively. (C) Adhesion strength as a function of individual nanoisland area (log scale). Values are means ± s.e.m., and logarithmic (natural base) fit is shown (solid line). The dashed line corresponds to the adhesion strength for the center-only pattern. Results for 0.0625 µm2 and 0.250 µm2 comprise 3 (250 nm×2, 250 nm×4, 250 nm×9) and 2 (500 nm×1, 500 nm×4) nanoisland patterns, respectively. (D) Adhesion strength values for 250 nm×4 patterns with different inter-island spacings (0.75 versus 1.25 µm), showing no differences in adhesive force.

