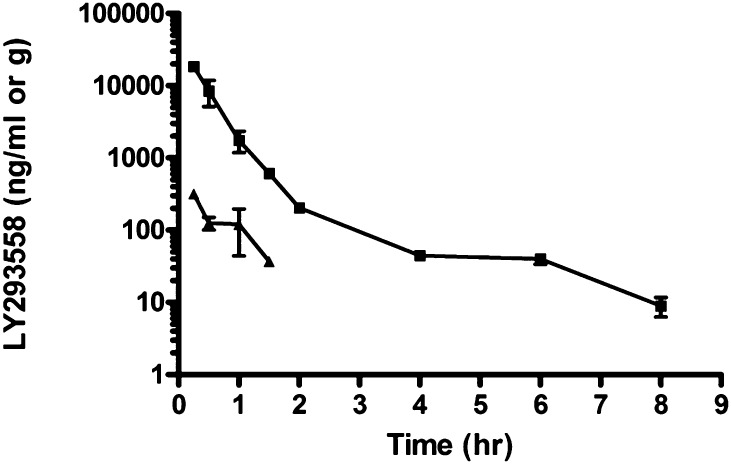
Fig. 5.
Plasma (square) and brain (triangle) concentrations of LY293558 after i.m. injection of 15 mg/kg. For plasma samples: n = 6 at time points 0.25, 0.5 and 1 hour; n = 3 at time point 1.5 hours and later. For brain samples: n = 3 for all time points, except at 1 hour, where n = 6. Data points represent the mean and standard deviation.

