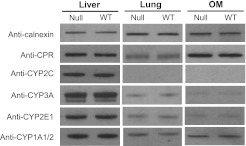
Fig. 4.
Immunoblot analysis of the expression of selected P450 and CPR. Microsomes were prepared from pooled liver, lung, or OM of WT and Cyp2a(4/5)bgs-null (Null) male mice (five per group, 2 months old). Microsomal proteins from the liver (5 µg per lane), lung, and OM (10 µg per lane) were analyzed for the expression of selected P450 or CPR proteins. The expression of calnexin was analyzed as a loading control. The antibodies used are described in Materials and Methods. Densitometric analysis (not shown) for each panel indicated that the maximal difference in band intensity between samples from WT and Null mice was less than 20%. Similar results were obtained in female mice (data not shown).

