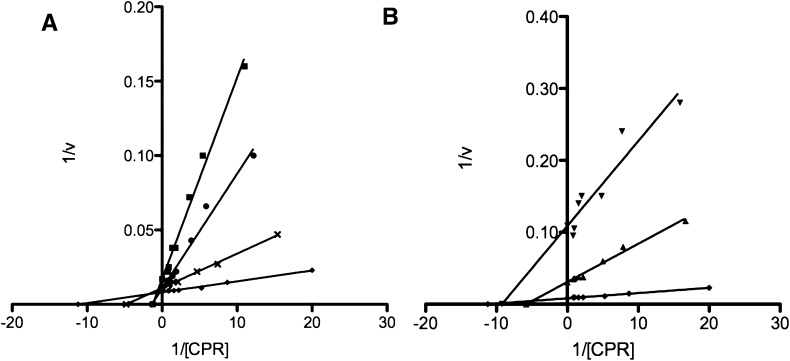
Fig. 4.
Lineweaver-Burk plots of the steady-state activity data presented in Fig. 3. The inverse of the rate of formaldehyde formation was plotted against the inverse of CPR concentrations (from Fig. 3) as a function of varying CYP2E1 concentrations. These data were divided into two sets based on whether the linear regressions intersected at a common intercept or not. For the following concentrations of CYP2E1 WT: 0 (♦), 0.125 (×), 0.25 (●), 0.75 μM (▪), CYP2E1 displayed competitive inhibition kinetics (A) while at higher concentrations, 1.25 (▴) and 1.50 μM (▾), CYP2E1 behaved as a noncompetitive (B) inhibitor.

