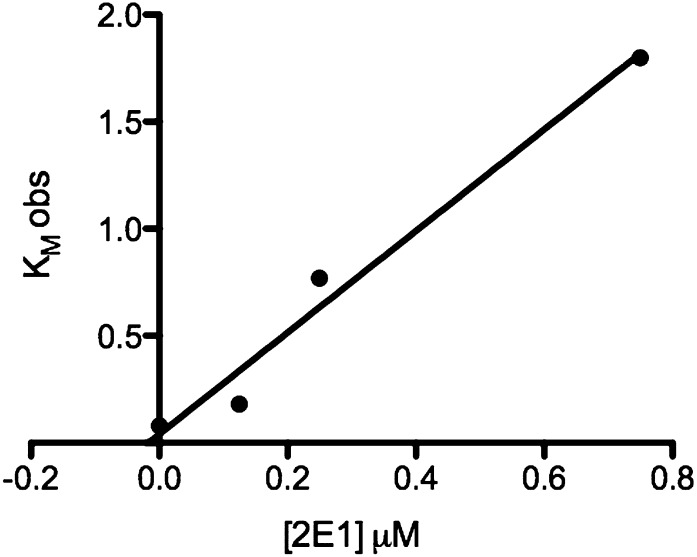
Fig. 5.
Plot of KM obs versus CYP2E1 concentration used to estimate the inhibition constant Ki. Estimates of KM obs were obtained from analysis of the activity data shown in Fig. 3. The solid line is the linear regression analysis of data for CYP2E1 concentrations from 0 to 0.75 μM. The absolute value of the x-intercept of the line represents Ki (approximately 20 nM).

