Fig. 3.
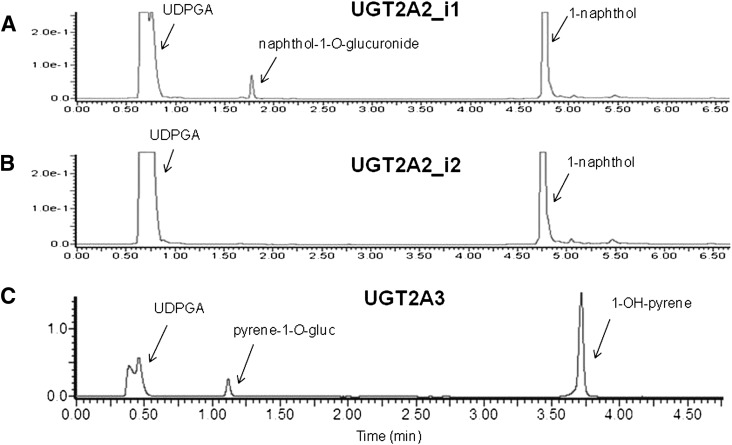
Representative UPLC chromatograms of UGT2A2 and UGT2A3 glucuronidation activities against PAH substrates. (A) UPLC trace of 1-naphthol-O-glucuronide formation following 1-naphthol incubation with UGT2A2_i1 overexpressing cell homogenate. A naphthol-1-O-glucuronide peak was observed at 1.8 minutes, and a 1-naphthol substrate peak was observed at 4.8 minutes. (B) no detectable 1-naphthol-O-glucuronide was observed following incubation of UGT2A2_i2 overexpressing cell homogenate with 1-napthhol, as shown by a representative UPLC chromatogram with only a 1-napthol substrate peak at 4.8 minutes. (C) UPLC trace of pyrene-1-O-glucuronide formation after 1-OH-pyrene incubation with UGT2A3 overexpressing cell homogenate. A glucuronide peak was observed at 1.1 minutes and a 1-OH-pyrene peak was observed at 3.7 minutes.

