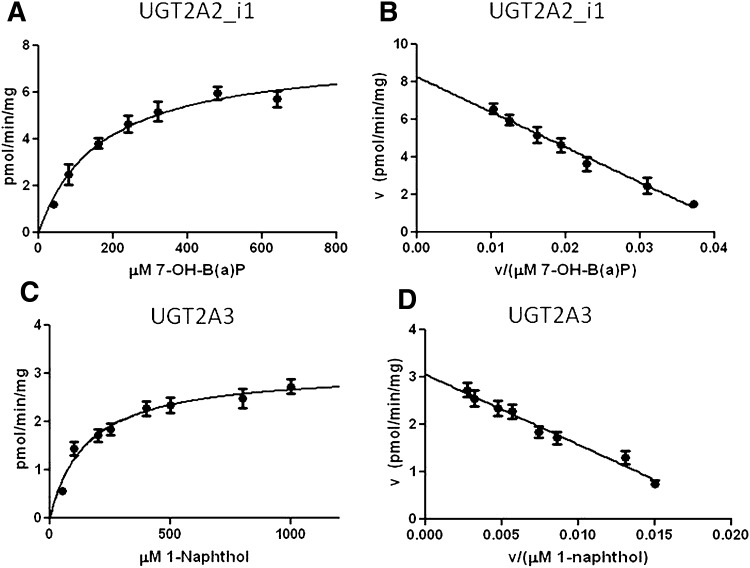
Fig. 4.
Representative enzyme kinetics curves for UGT2A2_i1 and UGT2A3 activity against PAH substrates. (A) representative Michaelis-Menten curve for UGT2A2_i1 activity against 7-OH-B(a)P. (B) Eadie-Hofstee transformation of UGT2A2_i1 activity against 7-OH-B(a)P. (C) representative Michaelis-Menten curve for UGT2A3 activity against 1-naphthol. (D) Eadie-Hofstee transformation of UGT2A3 activity against 1-naphthol.

