Figure 3.
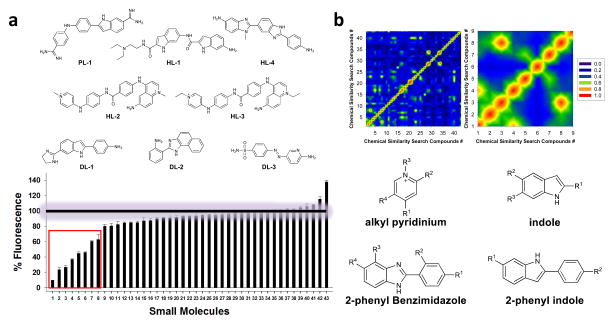
Solution-based screen and chemoinformatic analysis of the hit compounds. a, solution-based screen identifies small molecules that bind 1 – 3. Top, the structures of the top eight ligands identified. Bottom, data for screening the entire library for binding 1. A “% Fluorescence” of 100% indicates that the compound does not displace TO-PRO-1 while “% Fluorescence” below 100% indicates that the small molecule binds the RNA and displaces TO-PRO-1. b, Chemoinformatic analysis of the hit compounds. Top left, two dimensional plot of the Tanimoto scores for each small molecule as compared to every library member. Top, right, a close-up view of the plot to the left for the top eight hit compounds. Bottom, results of common scaffold analysis of the top eight hit ligands reveals features in chemical space that facilitate RNA binding.

