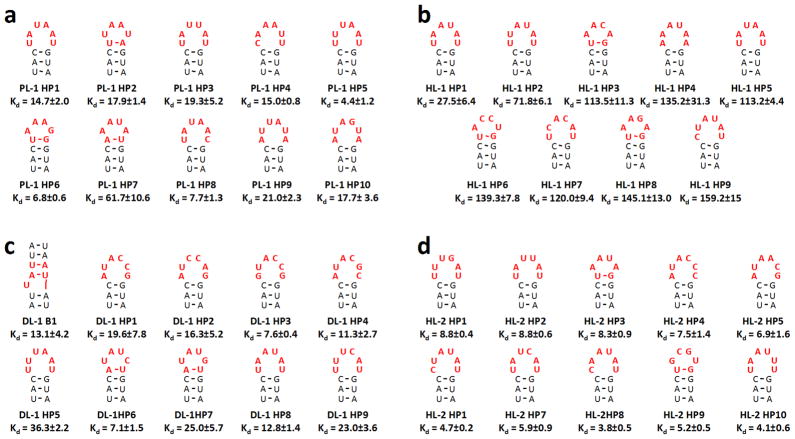
Figure 5.
Secondary structures and affinities of the selected RNA motif-ligand interactions. The secondary structures shown were predicted by free energy minimization using the RNA structure program 31. The RNA motif-ligand partners that were subjected to binding assays were predicted to have the highest affinities based on analysis by Structure-Activity Relationships Through Sequencing (StARTS) 49–51. The red letters in the secondary structures indicate nucleotides that are derived from the randomized region of the libraries; the secondary structure shown is from the boxed nucleotides in Figure 2. All dissociation constants (Kd’s) are reported in micromolar. PL-1, HL-1, HL-2, and DL-1 do not bind oligonucleotide 8 (Figure 2; GAAA tetraloop) or the starting libraries 1 – 3 (Kd >200 μM). a, the RNA motifs selected to bind PL-1. b, the RNA motifs selected to bind HL-1. c, the RNA motifs selected to bind DL-1. d, the RNA motifs selected to bind HL-2. In the RNA identifiers, “B” indicates a bulge while “HP” indicates a hairpin. Each experiment was completed in triplicate, and the error bars are the standard deviations.

